
From Bet Stats to Insight
Building a lightweight data pipeline to support exploratory analysis and visualization
Introduction - The Problem Statement
Prior to this project, my experience was almost entirely centered on building full-stack websites—designing interfaces, managing databases, and implementing backend logic using tools like PHP, HTML, CSS, and JavaScript. While this gave me a strong foundation in building end-to-end applications, I wanted to widen my skill set and move closer to the data side of problem-solving.
This project was a deliberate step in that direction. Through Bet Stats, my goal was not just to build another web application, but to integrate Python-based analytics into my existing projects in order to generate meaningful insights and visualizations around player performance and game trends. It marked an intentional shift from focusing solely on application structure to focusing on how data is processed, analyzed, and communicated.
1 Exploratory Analysis
Although this project was not designed around formal statistical inference, exploratory data analysis played a key role in shaping the analytical layer of the application. Using Python and Pandas, I explored player-level and game-level datasets to understand distributions, variability, and emerging patterns in performance metrics.
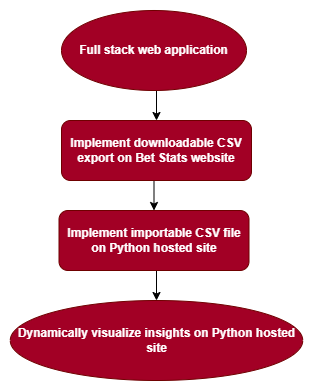
Figure 1— System workflow used to facilitate exploratory data analysis across a web-based and Python-hosted environment.
This exploratory process helped me determine which statistics were meaningful to visualize and which were too noisy or inconsistent for user-facing insights. In this context, EDA functioned as a practical decision-making tool—bridging raw data and visualization by clarifying what information would actually be useful to users.
2 Methodology
To integrate Python analytics into a website I had already built, I initially set up a separate Python server alongside my PHP-based web server. The architecture involved sending requests from the main server to the Python server, which processed the data, generated graphs using Matplotlib, and returned the images to be rendered on the site.
While this approach worked, it introduced performance delays and additional complexity due to cross-server communication. As I evaluated the trade-offs, I decided to simplify the system by allowing the Python server to render visualizations directly within an HTML page.
This decision reduced overhead, improved performance, and allowed me to focus more on data handling, transformation, and visualization rather than maintaining an overly complex infrastructure.
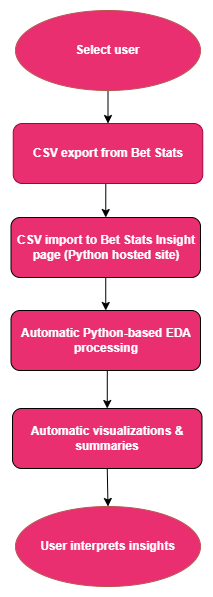
Figure 2— The diagram illustrates how user-selected data is exported from Bet Stats, processed through an automated Python-based exploratory data analysis pipeline, and transformed into dynamic visualizations and summaries that support interpretation and insight discovery.
3 Results
The final implementation successfully generated dynamic visualizations based on uploaded CSV data, allowing player and game statistics to be analyzed and displayed through a Python-driven workflow.
By simplifying the architecture, the application became more responsive and easier to maintain. More importantly, it enabled me to spend more time working with the data itself—cleaning, transforming, and visualizing it—rather than managing server-to-server communication.
4 Findings and Analysis
This project reinforced the value of balancing engineering ambition with analytical focus. From a technical standpoint, I gained experience managing multiple server environments, designing APIs for cross-server communication, and making architectural trade-offs aligned with project goals.
From an analytical perspective, the project helped shift my mindset. Rather than building for the sake of complexity, I began prioritizing clarity, interpretability, and usefulness of insights. EDA informed what was worth visualizing, while Python provided the tools to automate and scale that analysis. This marked a meaningful transition from full-stack implementation toward data-driven reasoning.
5 Conclusion
This project represented an intentional step away from building full-stack applications alone and toward developing deeper data analytics skills. It taught me that effective data work is not about building the most complex system, but about choosing the right tools, simplifying when necessary, and focusing on insights that matter.
As I continue to transition further into data analytics, I plan to deepen my ability to ask stronger analytical questions, extract actionable insights, and automate analysis pipelines using Python. This project laid the groundwork for that shift and clarified how I want to position my work at the intersection of analytics, engineering, and user-centered design.
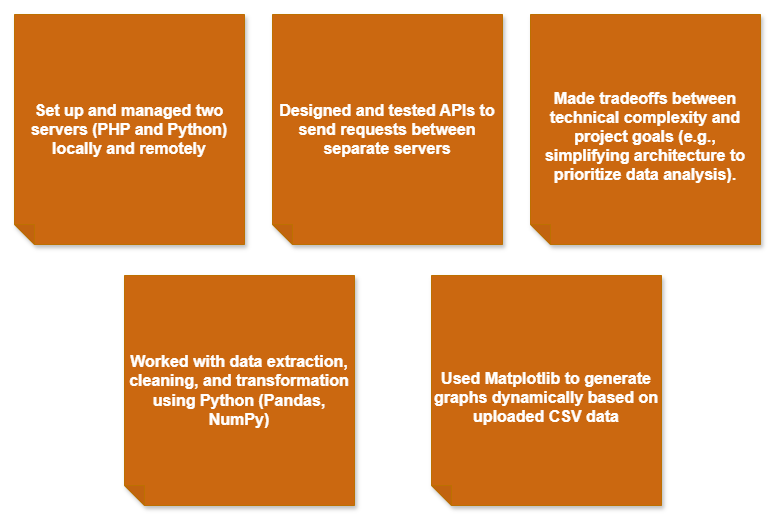
Figure 3— Summarizes skills gained across server management, API design, data handling, visualization, and architectural decision-making, highlighting the shift from full-stack development toward data-driven analysis.