
Do Reddit Sentiments Reflect Economic Reality?
Blending Statistical Inference and Predictive Modeling for
Economic Sentiment Analysis
The foundation of data mining is selecting appropriate models and understanding their predictive performance. Recall there are two cultures of modeling according to Professor Breiman: statistical inference or generative modeling and prediction or predictive modeling. For this project, public Reddit posts are classified as either negative, neutral, or positive and aimed to compare the country’s attitude to economic trends like housing prices or unemployment rates. To predict sentiment from raw posts, however, it’s important the right model and features are selected for credibility in classifying and quantifying posts. This project encapsulates a blend between generative modeling and predictive modeling. Statistical inference is used to evaluate the relationships between textual features and sentiment labels, guiding the feature selection. Predictive models, including logistic regression and random forests, are trained using these features to classify public posts by sentiment. The integration of the two modeling cultures is guided by the research question: do public attitudes (captured through Reddit) reflect or predict real-world economic trends or policy effects?
Introduction - The Problem Statement
The iterative process between cleaning, extracting, and running models through different features is inherently not a linear process. To ensure rapid experimentation and completing the sentiment analysis with a variety of different datasets, features, and proper usage of models, a sample of four different datasets were finalized. The sample datasets and pipeline can be considered as an early prototype demonstrating the evolution of the modeling process. Differentiating sentiment from different cultures of social media platforms, topics of conversation, and emotions like sarcasm or humor are challenges that long-standing research communities continue to address, each with its own specialized goals. Creating a sentiment pipeline specifically for platforms like Reddit, and classifying conversations relating to economic realities, is the heart of this project.
1 Exploratory Analysis
1.1 Dataset Sources
All results reported in this paper are based on the sample training and test datasets (800 and 200 samples, respectively), and an additional set combining all datasets (4000 samples). The subsets below, reflect the performance between three different sets of feature extraction and a glimpse of downsampling logic.
Joshi Dataset — Is a sentiment classified dataset containing raw reddit extractions, uploaded by Vijay Joshi on Kaggle
La Dataset — Is a sentiment classified dataset, containing ‘News Headlines’ text, uploaded by Moritz Laurer on Hugging Face.
Kumar Dataset — Is a sentiment classified dataset containing text posted on Reddit and Twitter, uploaded by Chaithanya Kumar A on Kaggle
Mashe Dataset — Is a sentiment classified dataset, predicted with BERT model for Reddit posts on a timely basis, uploaded by Michael Mashe on Github
Combined Dataset — Is a combination of all datasets, as a form of mild cross validation
The original datasets were relatively clear from duplicates and NA. The majority of cleaning datasets involved removing leading and trailing white spaces, website links, and columns that don’t contain text or sentiment values. All columns were renamed and ordered to the respective labels [‘sentiment’, ‘text’] and sentiment values were renamed with respect to their meaning [‘positive’, ‘neutral’, ‘negative’] (see figure 2) for cleaning.
As for class imbalances with sentiment labeling, the datasets were downsampled in two ways:
- Downsample logic 1 aims to combine all the datasets, retaining as much data as possible, while balancing sentiment class distribution as a whole. Due to disproportionate sizes, this requires minimizing ‘Positive’ and ‘Negative’ sentiment labels in Kumar’s dataset to offset the missing ‘Neutral’ sentiment in La and Joshi datasets (see figures 4 and 5).
- Downsample logic 2 aims to cut off each dataset to 1000 samples, minimizing possible bias from disproportionate sample sizes and a balanced distribution within each dataset for sentiment values that are available (see figure 3).
For the sake of this project, downsample logic 2 is used as a means to quickly evaluate and evolve feature engineering practices. Following downsampling, train and test splits are constrained to sentiment proportions, ready to begin the pipeline (see figure 1) for modeling.
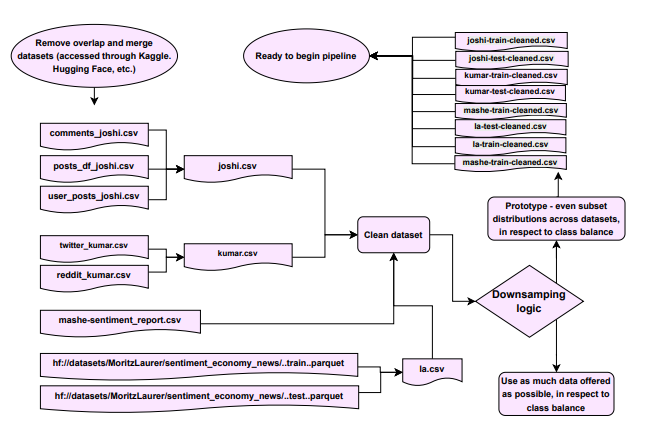
Figure 1— Flowchart for cleaning data, downsampling for model pipeline experimentation, and splitting train and test subsets in respect to sentiment class balance.
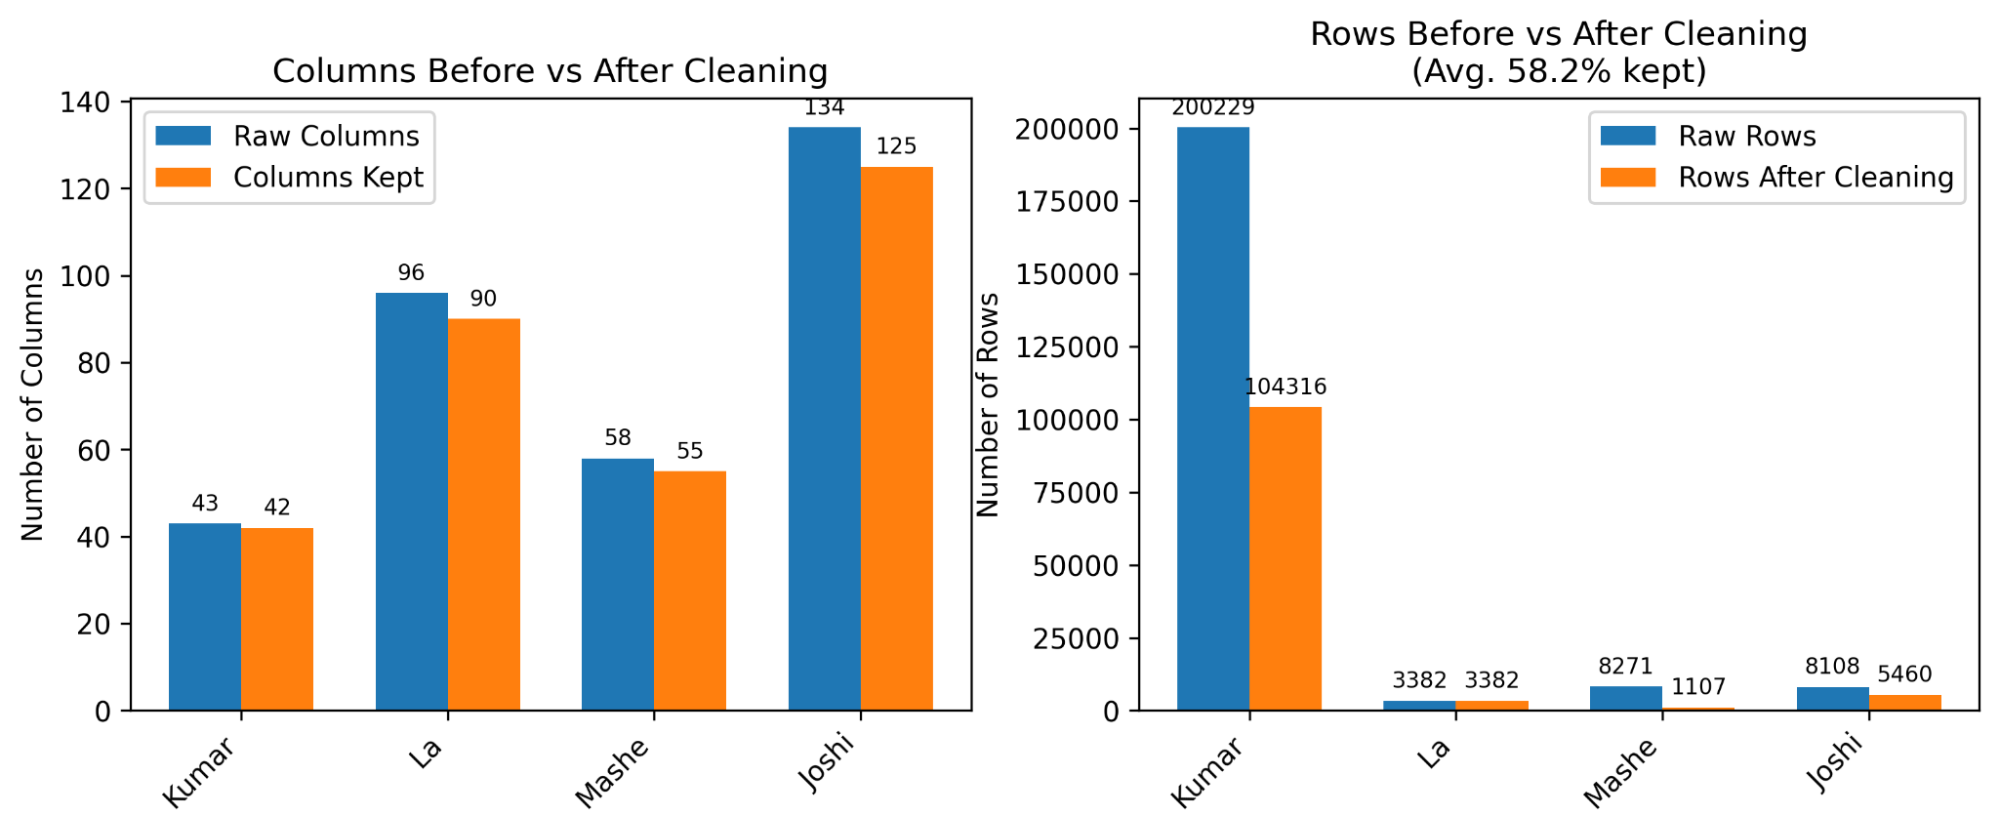
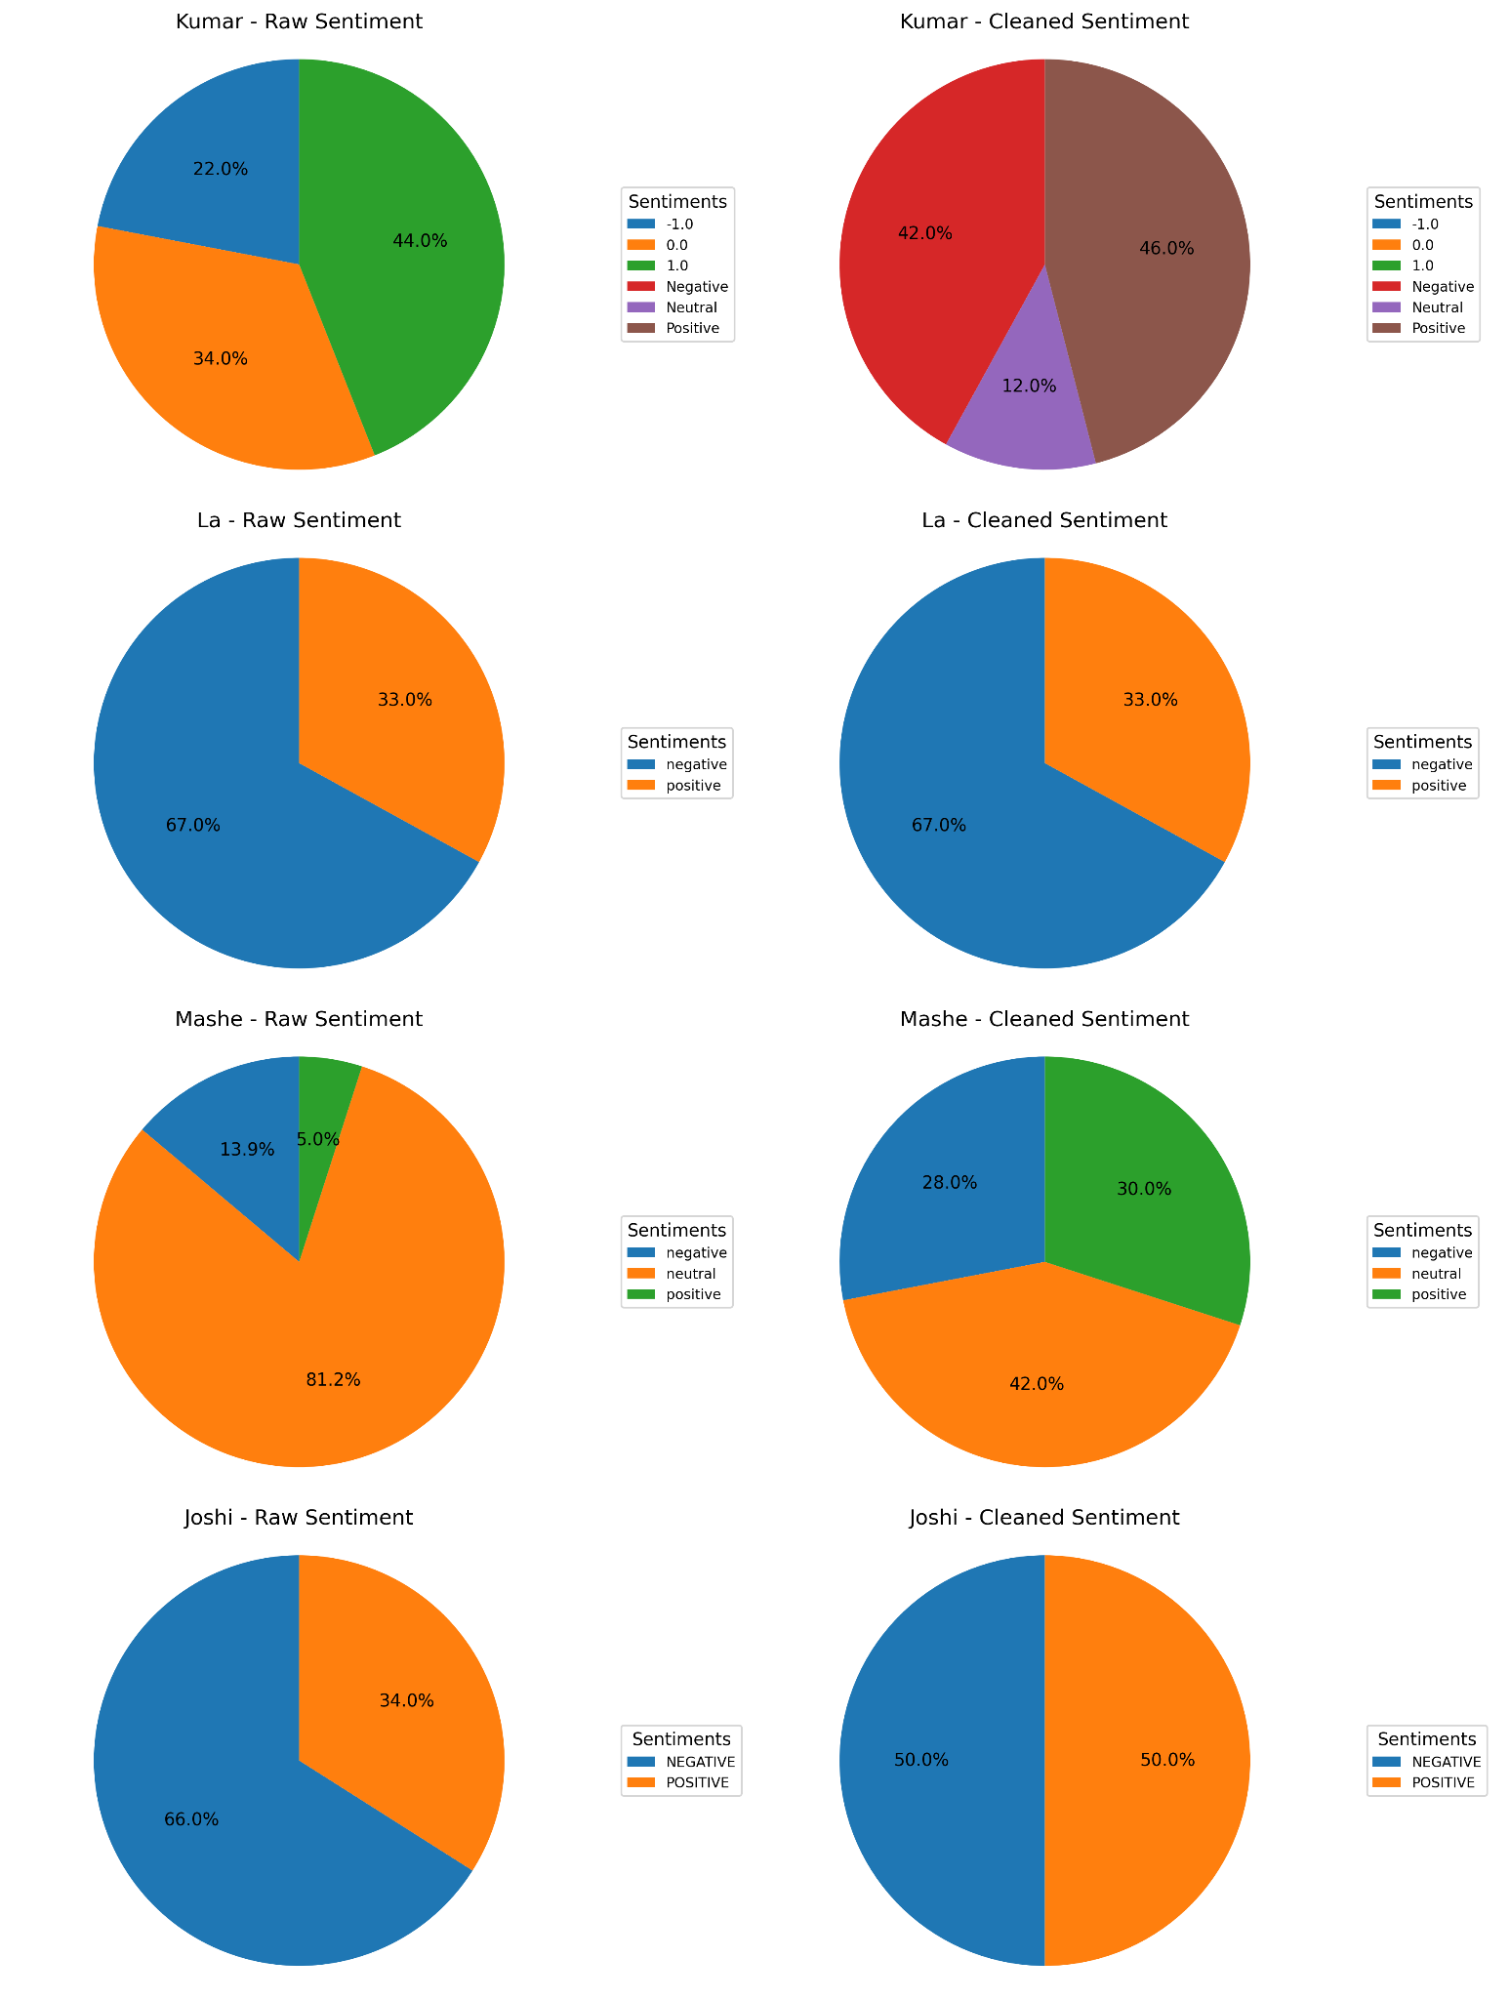
Figure 2— Columns and rows of original datasets before and after cleaning (no downsampling), and Sentiment distribution of original datasets before and after cleaning. Kumar’s sentiment values are renamed from [1.0, 0, -1.0] to [‘Positve’, ‘Neutral’, ‘Negative’]. Kumar has the largest number of rows and La has the least number of rows.
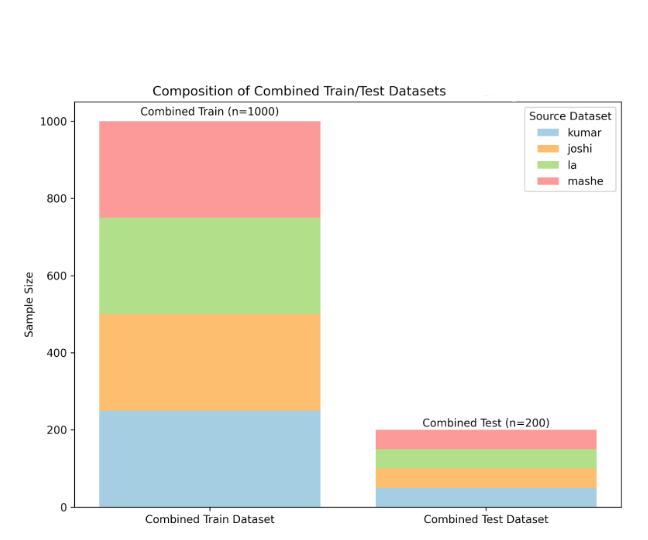
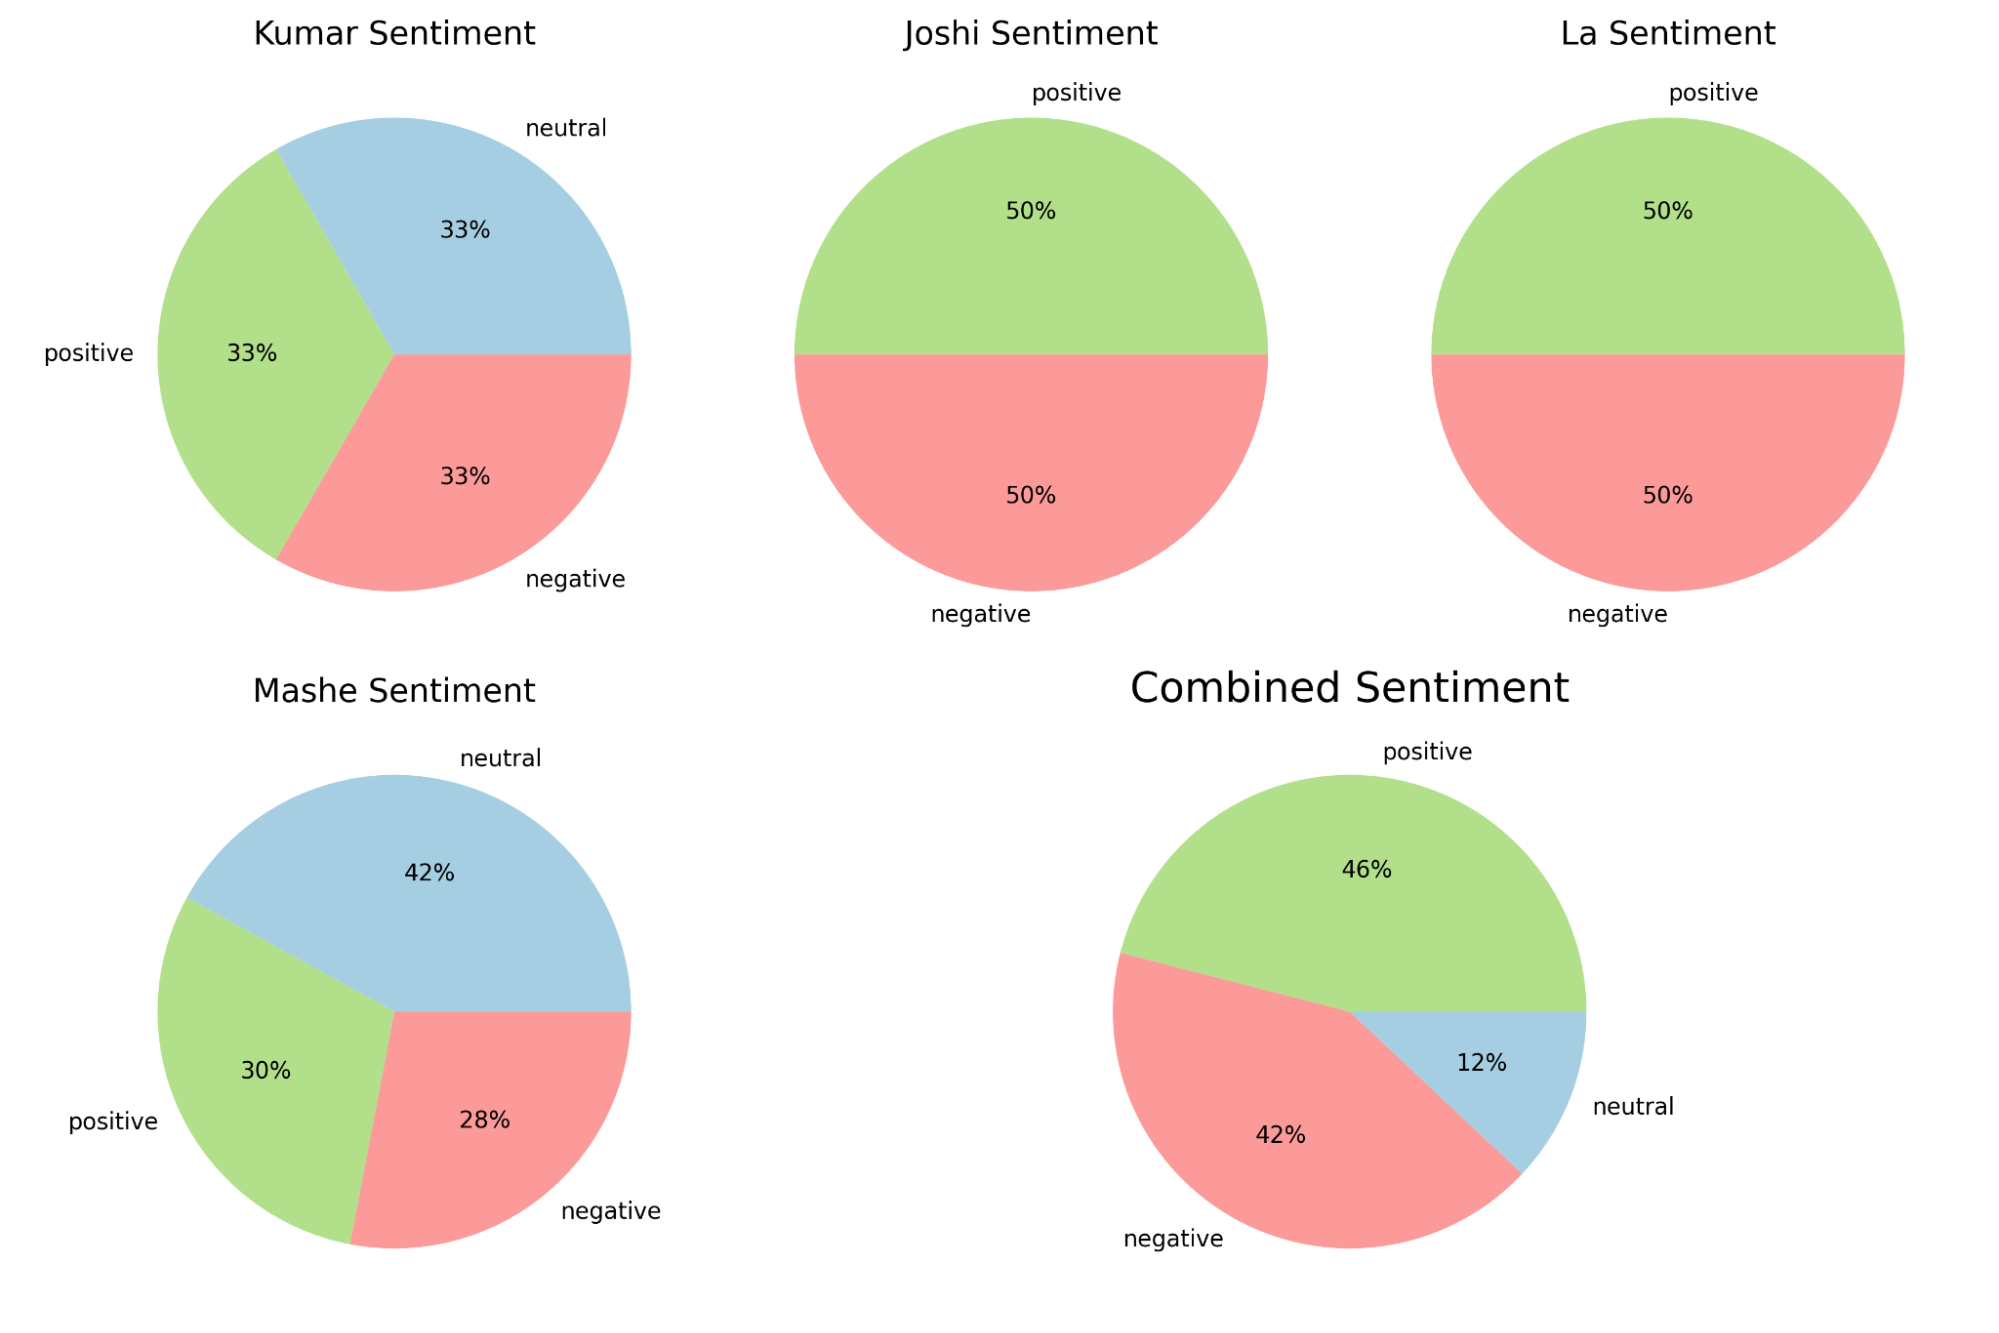
Figure 3—Train and test compositions of the combined dataset, and sentiment class balance for each dataset: Kumar, Joshi, La, Mashe. Joshi and La did not have neutral sentiments, reflected in the balance of Combined Sentiment .
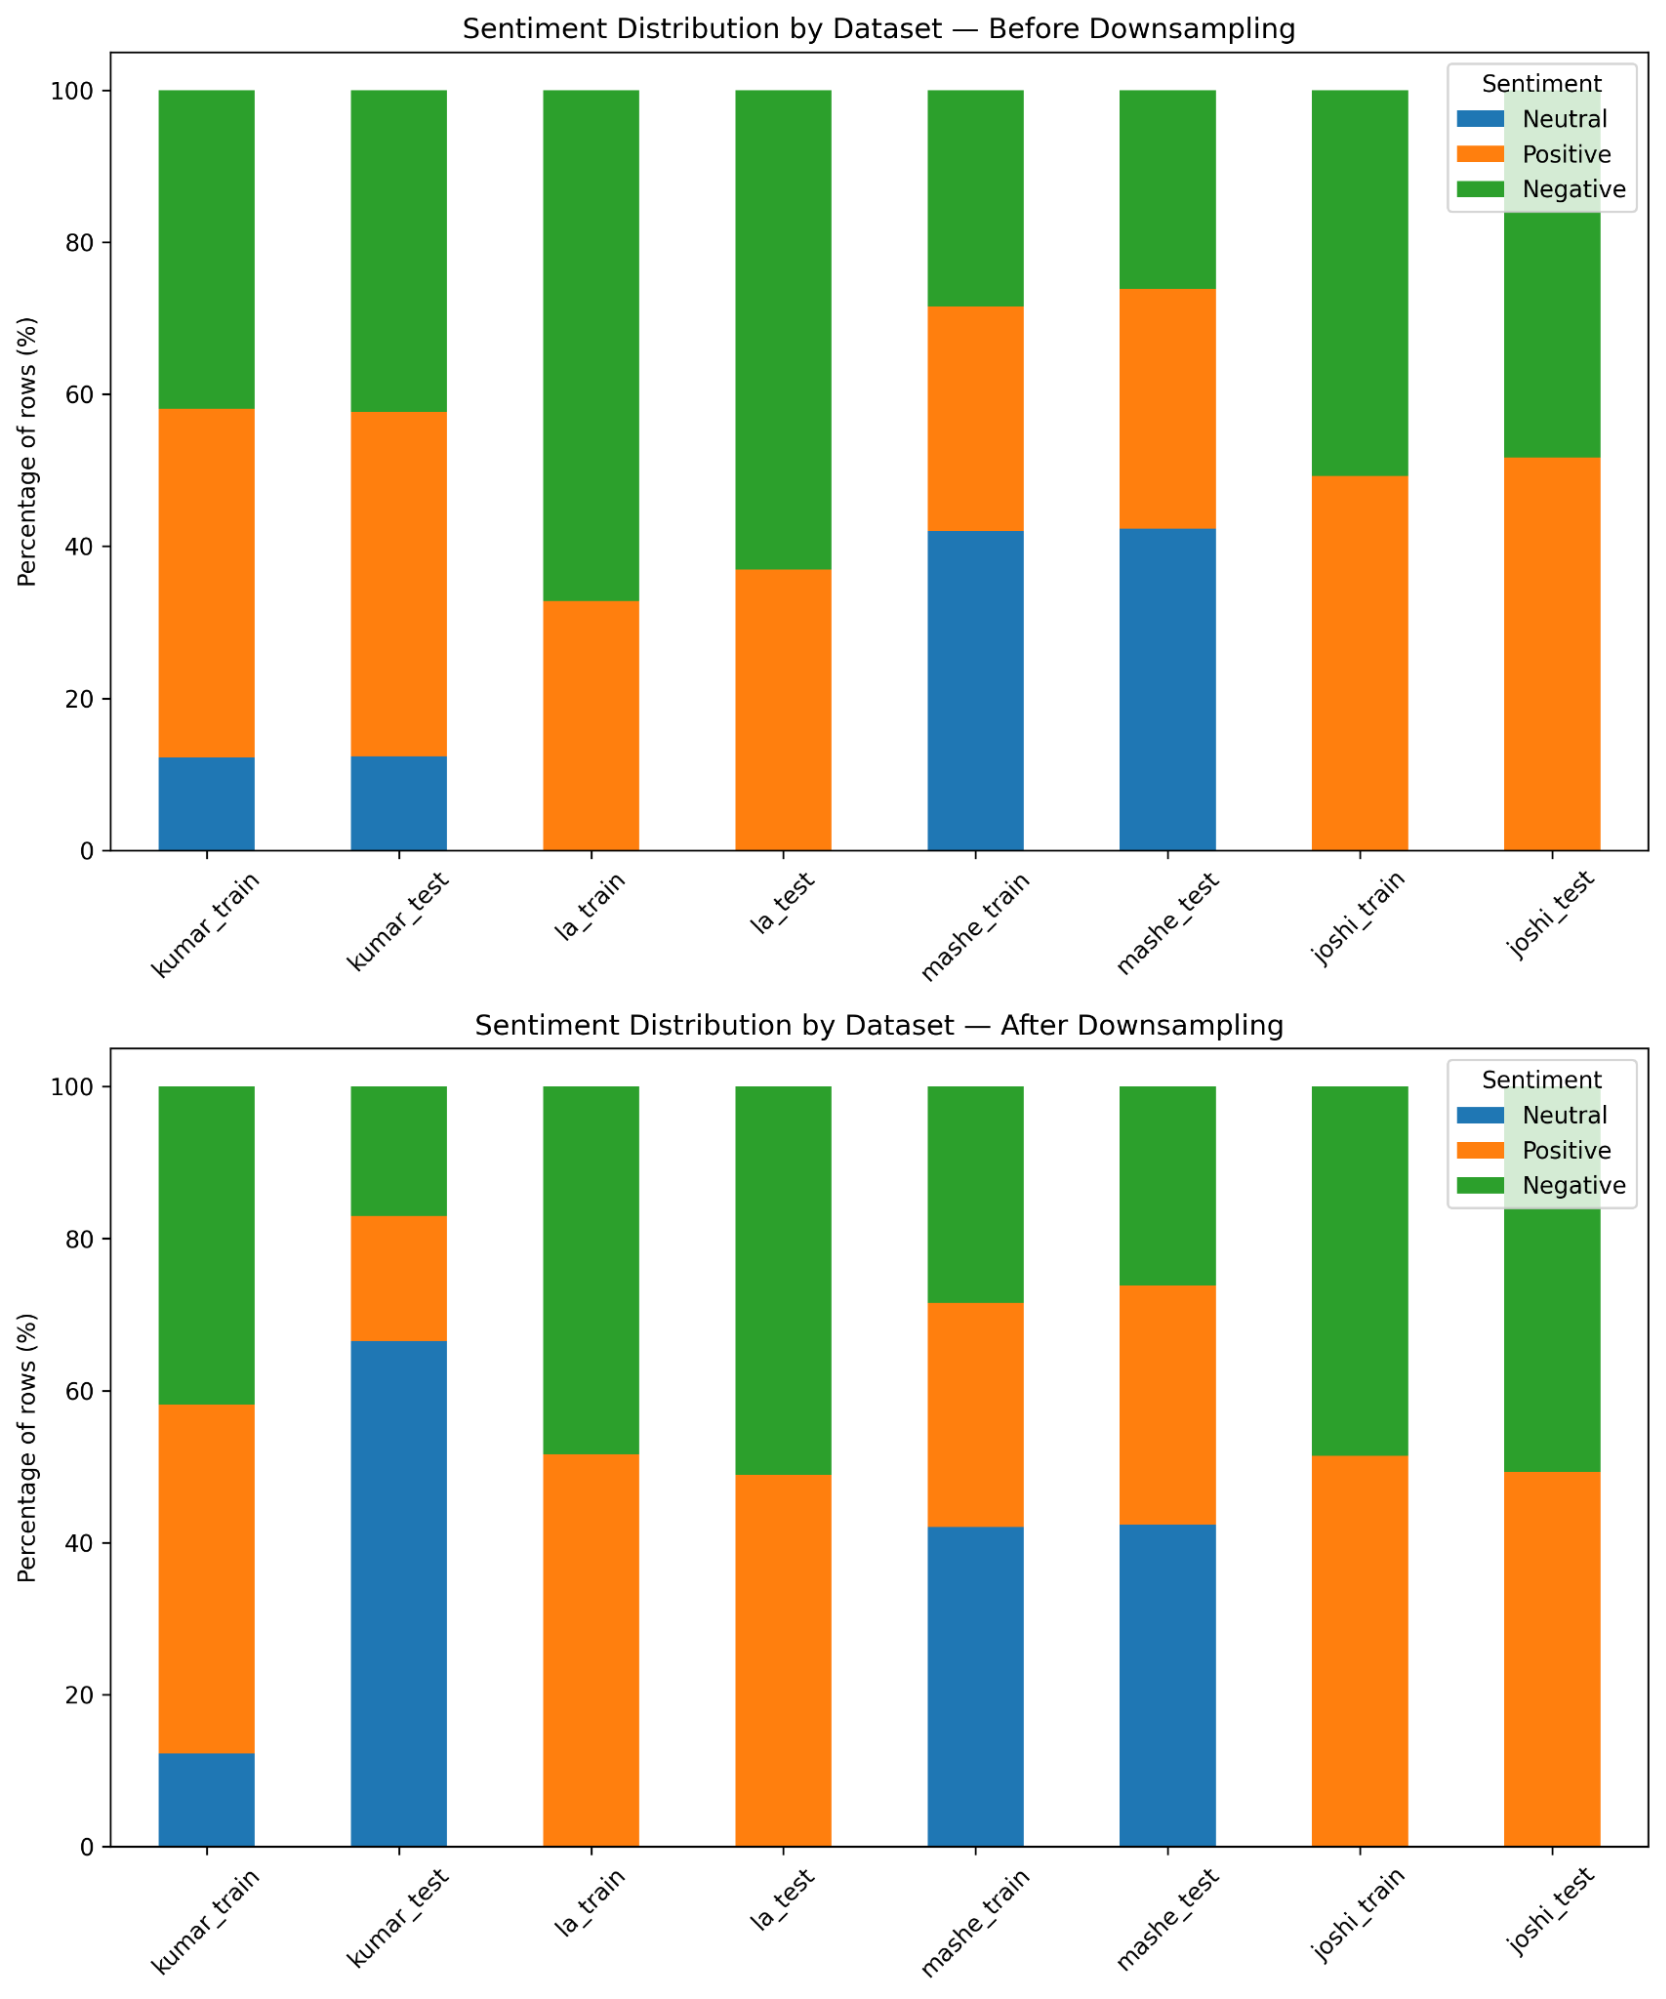
Figure 4— Downsamping logic to retain as much data as possible in each data set, while protecting class balance when all data sets are combined. When not minimized to samples of size 1000, neutral samples are tripled in Kumar dataset to offset datasets like La and Joshi that don’t have neutral sentiments.
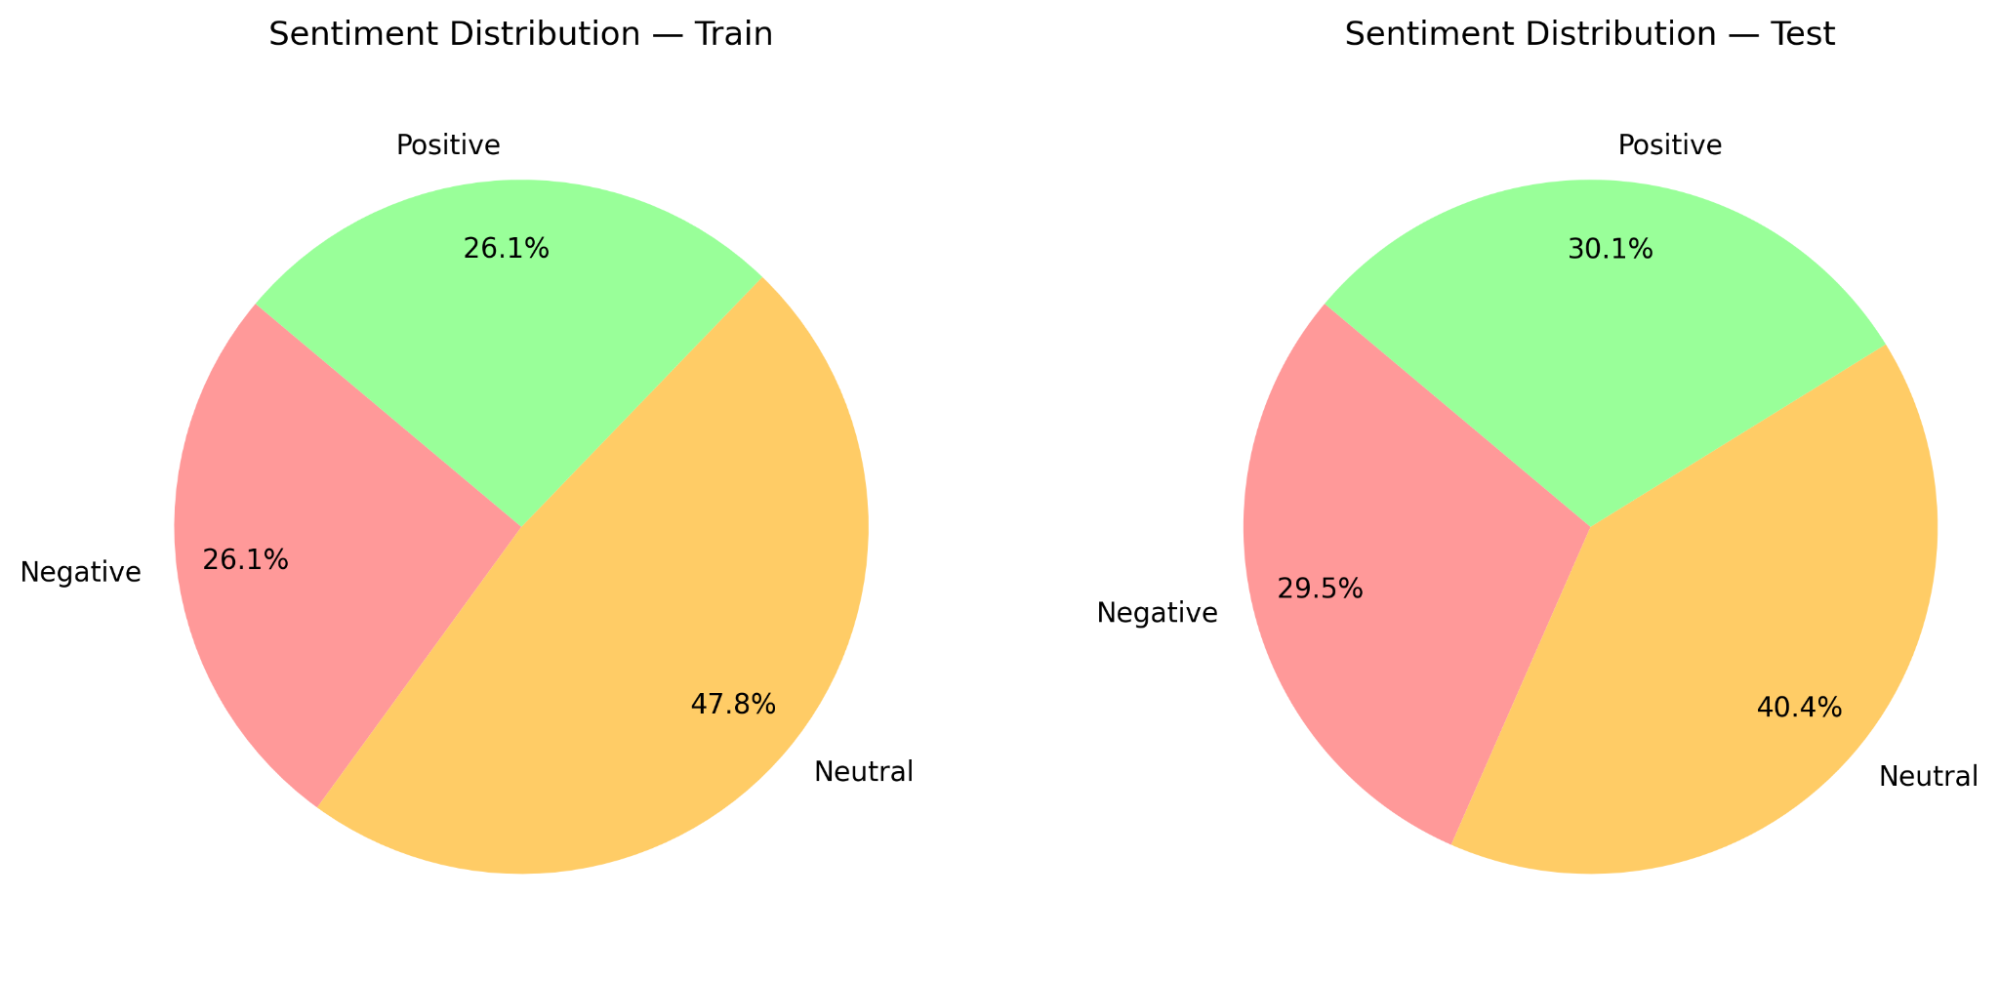
Figure 5— All datasets combined with downsamping logic of retaining as much data as possible in each data set. Split into subsets of 80% train and 20% test.
1.2 Reddit Extraction Sources
Using the PRAW API, Reddit posts are extracted through https://developers.reddit.com/, using their API guidelines and registering for a token. Post retrievals were from the following threads : economics, housing, finance, inflation, employment.
Cleaning involves keeping columns and renaming them to their respective values of [‘text’,’date’] and removing NA and duplicate values (see figure 4). Before cleaning, overlap between datasets retrieved are checked and merged where applicable (see figure 5 and 7).
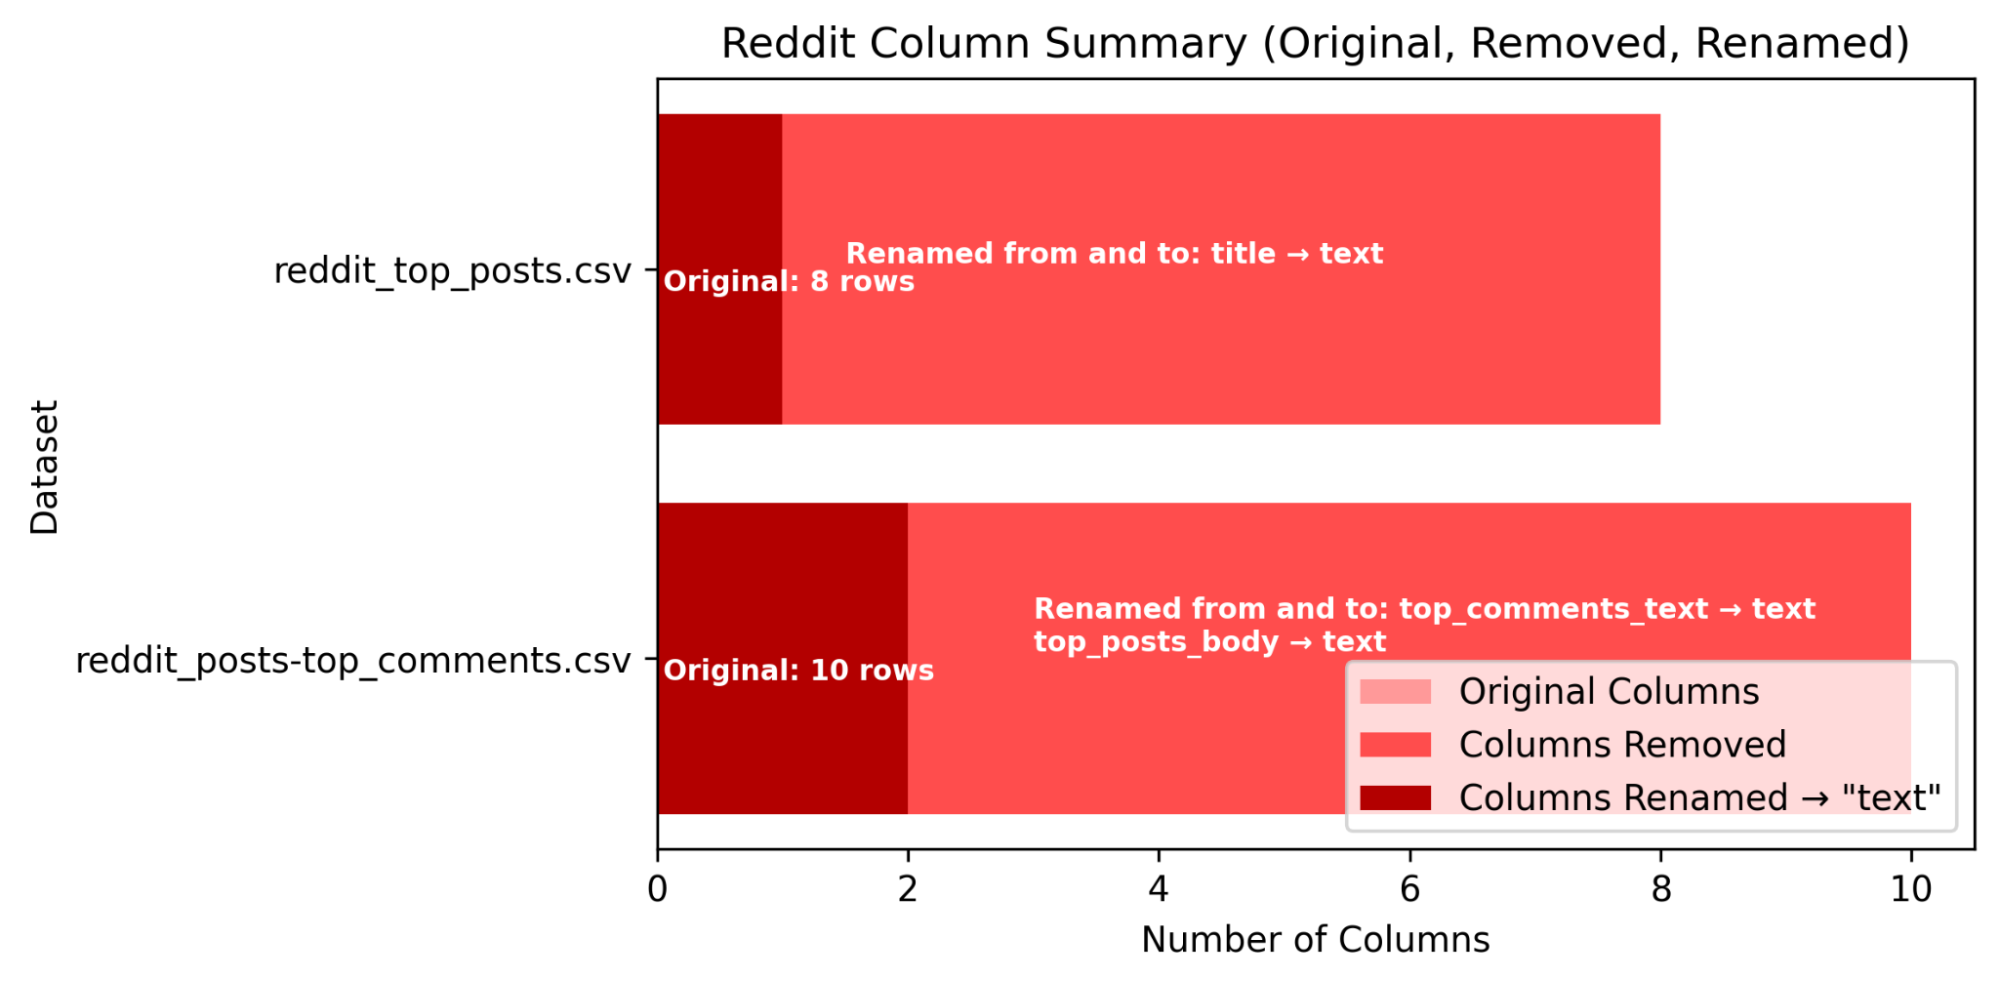
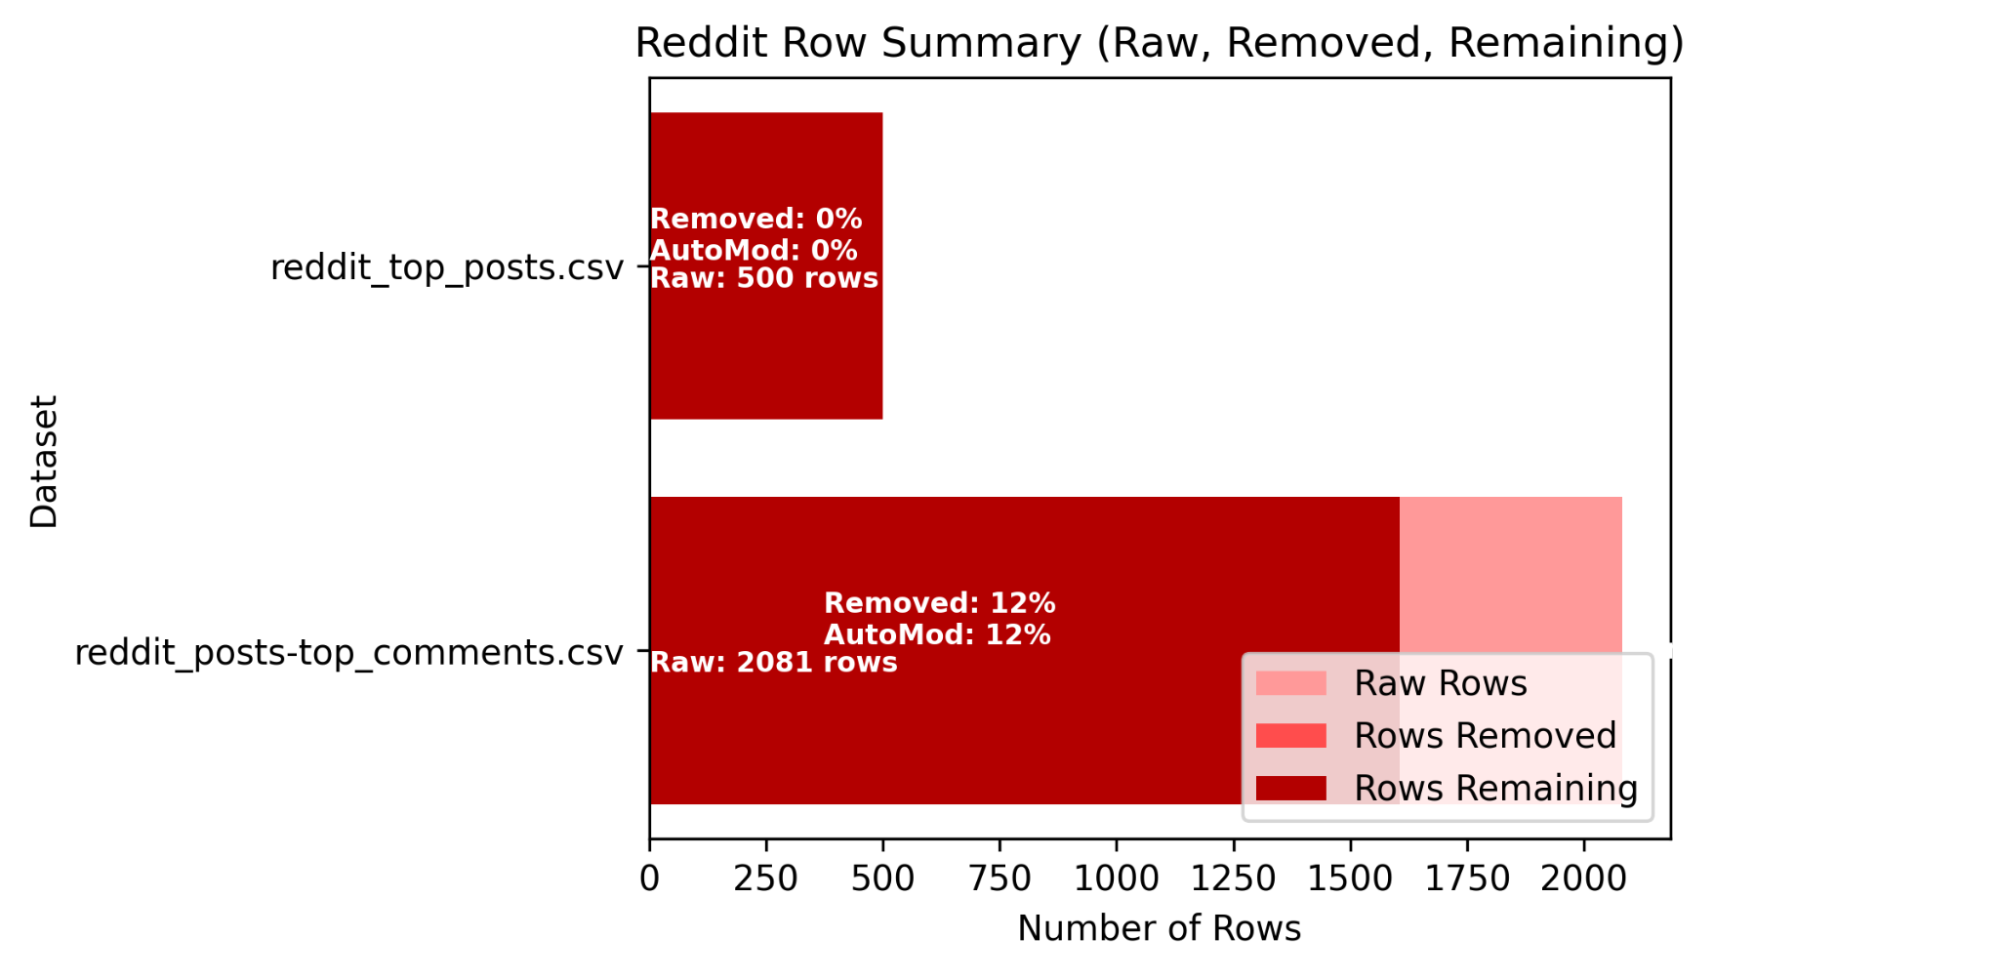
Figure 6— Columns and rows of Reddit datasets before and after cleaning.
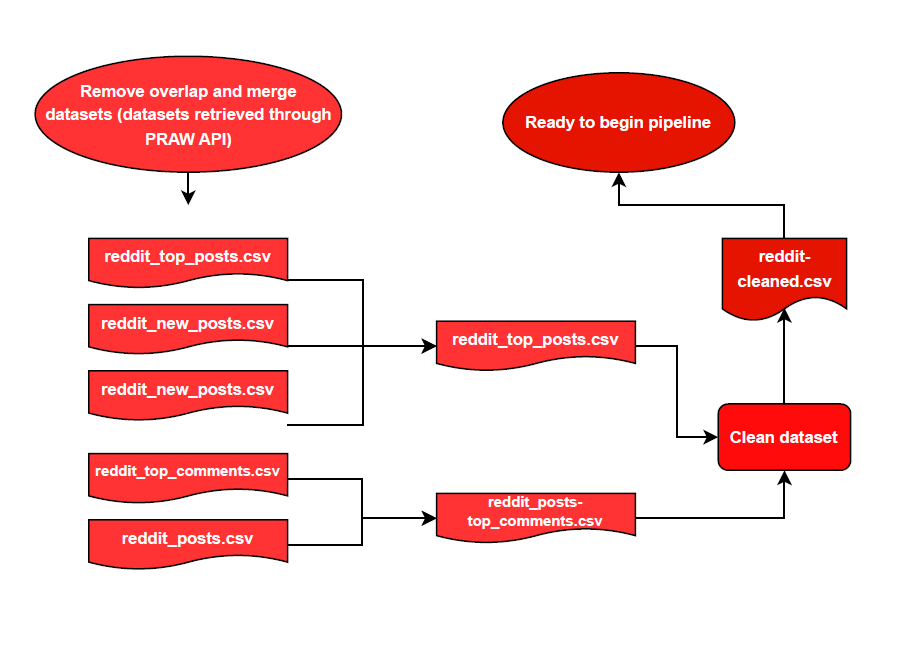
Figure 7— Flowchart for the preparation of Reddit posts for prediction modeling; Data extracted from PRAW API had duplicate files under different names.
1.3 Feature Extraction Sources
Spam UCI and SMS UCI datasets — is used to conduct performance of the spam baseline model, inspired by Spam UCI features and additional structural features, discussed in 2.1.
Structural Features — Computed and identified underlying text patterns through regex pattern matching, and computing for [average, longest, and lowest capitalization runs and counts words, chars, digits, and symbols].
Core Lexicon Features — NLP Vader Sentiment Analyzer model extracted [pos, neu, neg, compound] and NLP TextBlob python library extracted [polarity, subjectivity] scores (see appendix).
Hybrid Features — A mix of all structural features, all core lexicon features, and NLP Finbert extractions of [Negative probability, Positive probability, Neutral Probability, Compound Probability based on explicit crisis or growth terms] (see appendix).
2 Methodology
Workflow is organized into three sections:
2.1 Statistic Inference and Generative Modeling for Spam and Sentiment Analysis
2.1.1 Spam — Drawing on the feature engineering practices established in the UCI Email Spam dataset, this project extracted counts of spam-associated words and character patterns alongside additional structural text features, including average and maximum capital letter run length, total capital usage, word count, and character count. To enhance applicability to non-email text sources, the feature set was further expanded to capture symbol frequency, digit frequency, exclamation and question mark usage, emoji presence, toxicity score (same practice discussed in 1.3), and the number of embedded links.
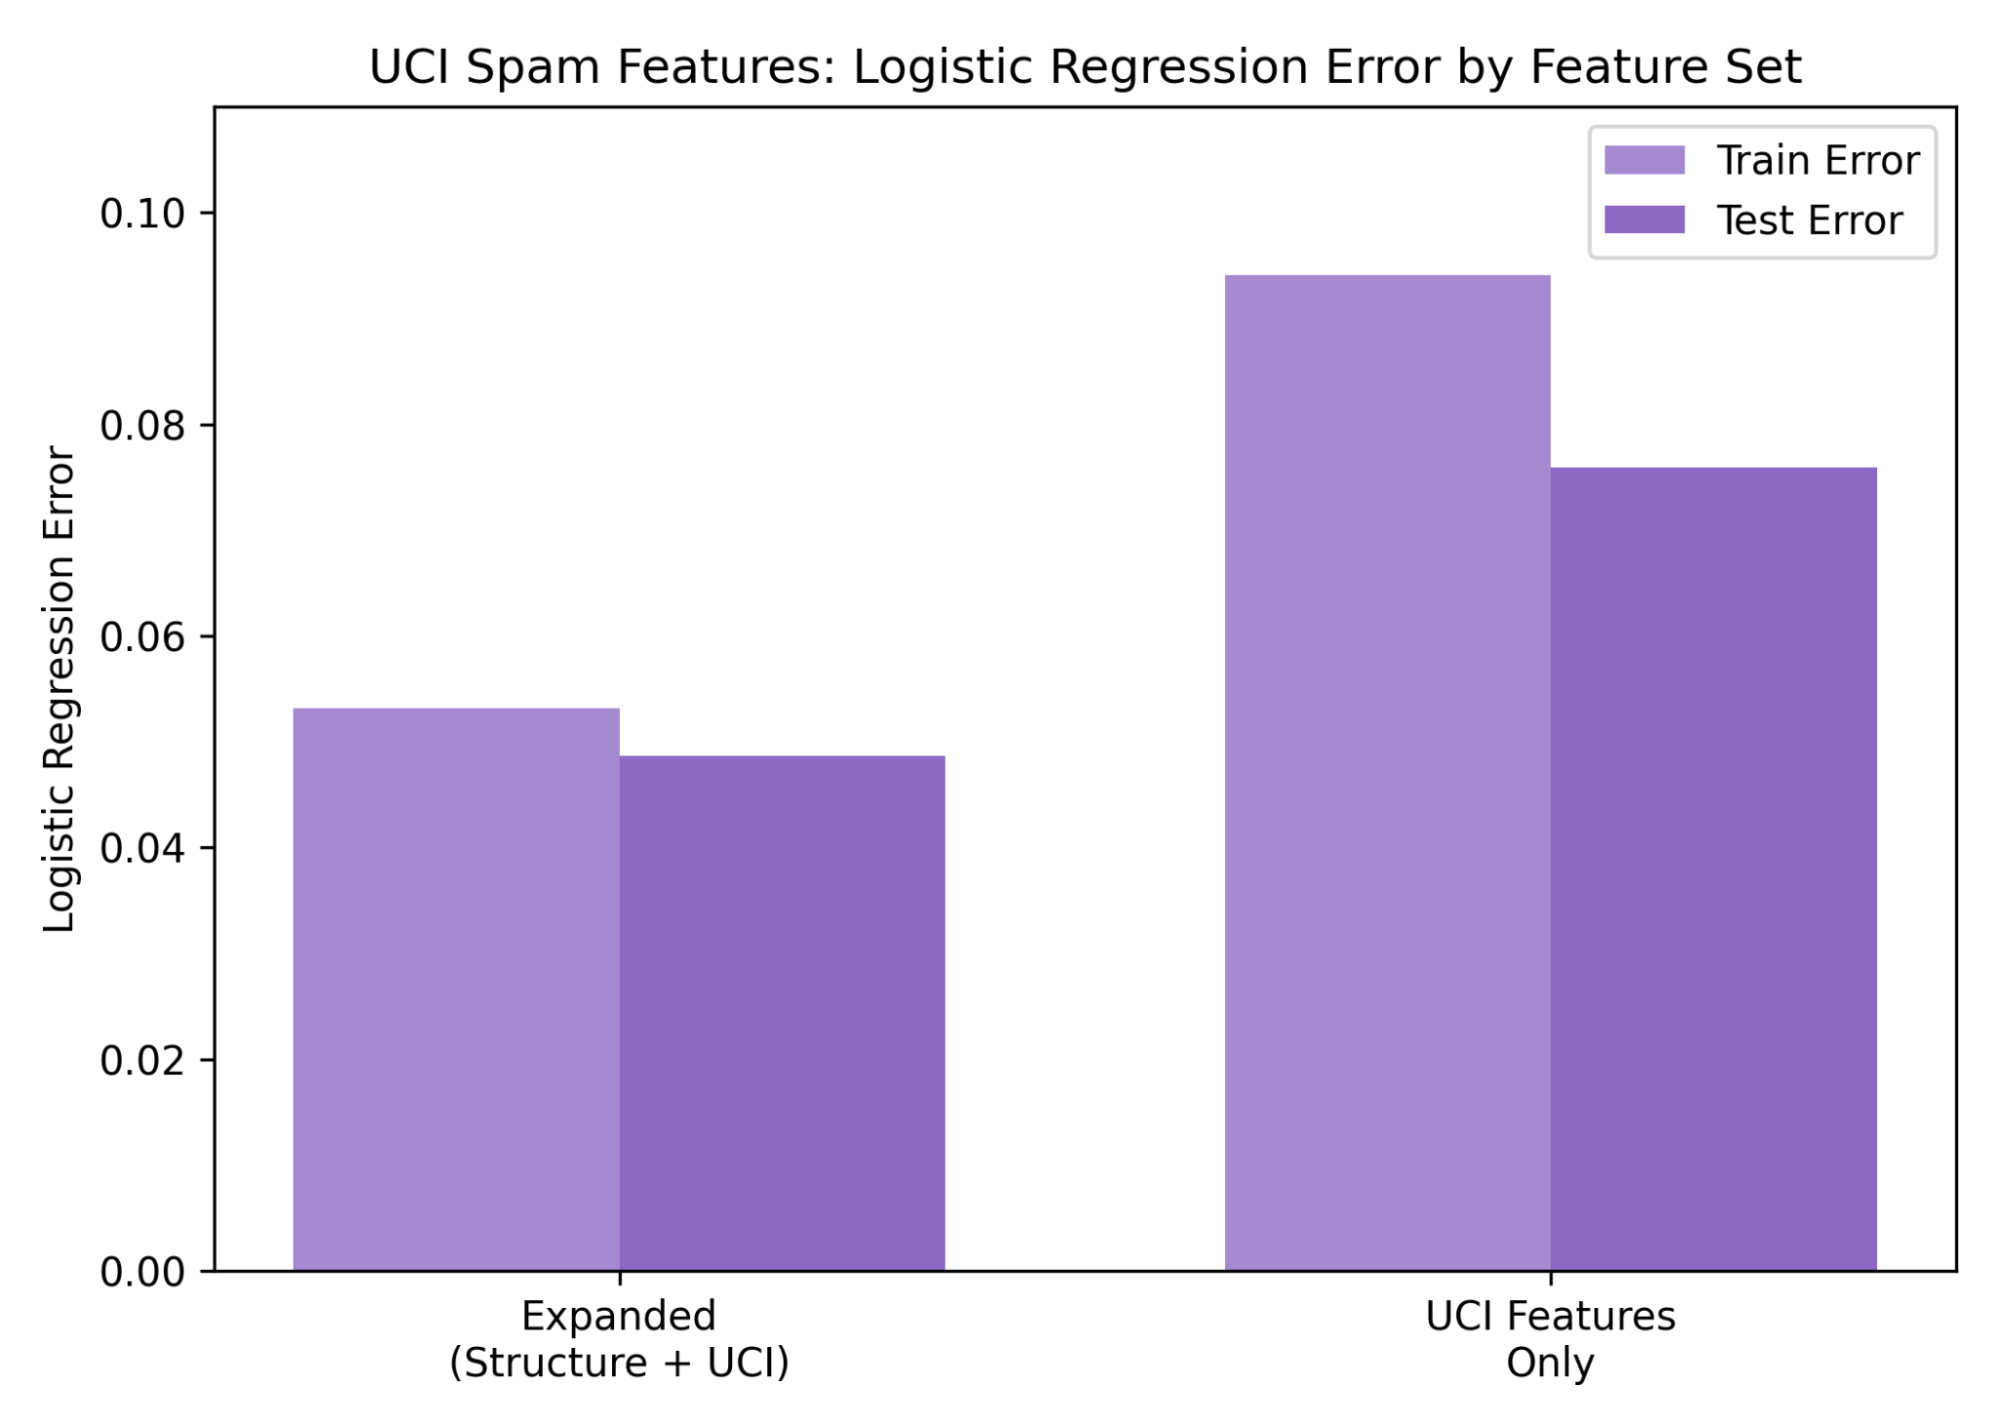
Figure 8—Logistic Regression prediction errors for UCI and UCI/Structural features. The expanded feature set slightly outperforms the UCI features on the UCI SMS dataset by .0409
The logistic model was used to evaluate performance. Because the UCI spambase database does not include sentiment values and primarily reports achieving a prediction rate of approximately 0.95 within its own experimental context, direct comparison was not feasible. To establish a meaningful benchmark, the UCI SMS Spam dataset, which contains a clear classification response, was used to test the predictive value of both the original UCI Email Spam features and the combined feature set. Results indicate that the extended feature set is highly capable of classifying sentiment outside of emails, thereby justifying its use for preliminary spam filtering.
2.1.2 Sentiment
Samples from each dataset were processed through a consistent feature extraction pipeline (see appendices 7 for implementation details). This approach enabled the removal of features that showed limited usefulness across contexts. Across multiple datasets, prediction error varied substantially, reflecting differences in linguistic norms, platform culture, and text formatting styles across social media sources. Initial feature engineering began with lexicon-based sentiment indicators, followed by experiments combining these features with various sentiment models. Feature importances were calculated for several social media datasets to identify which textual characteristics contributed most consistently to predictive performance.
Because prediction behavior differed widely between datasets, the analysis shifted toward sources that more closely matched the style and economic context of the Reddit posts intended for final evaluation. This transition led to the use of the FinBERT model and an economic sentiment dataset. Although this dataset aligned more closely with the economic focus of the target Reddit posts, platform-specific differences—such as writing style, community conventions, and text length—remained.
The final feature set was narrowed to Hybrid Features (see 1.3), including sentiment models such as VADER and FinBERT, along with lexicon-based features designed to adjust for variation in text length across platforms. This refined set of features provided a more stable and adaptable foundation for analyzing sentiment in economic discussions on Reddit (see 2.2).
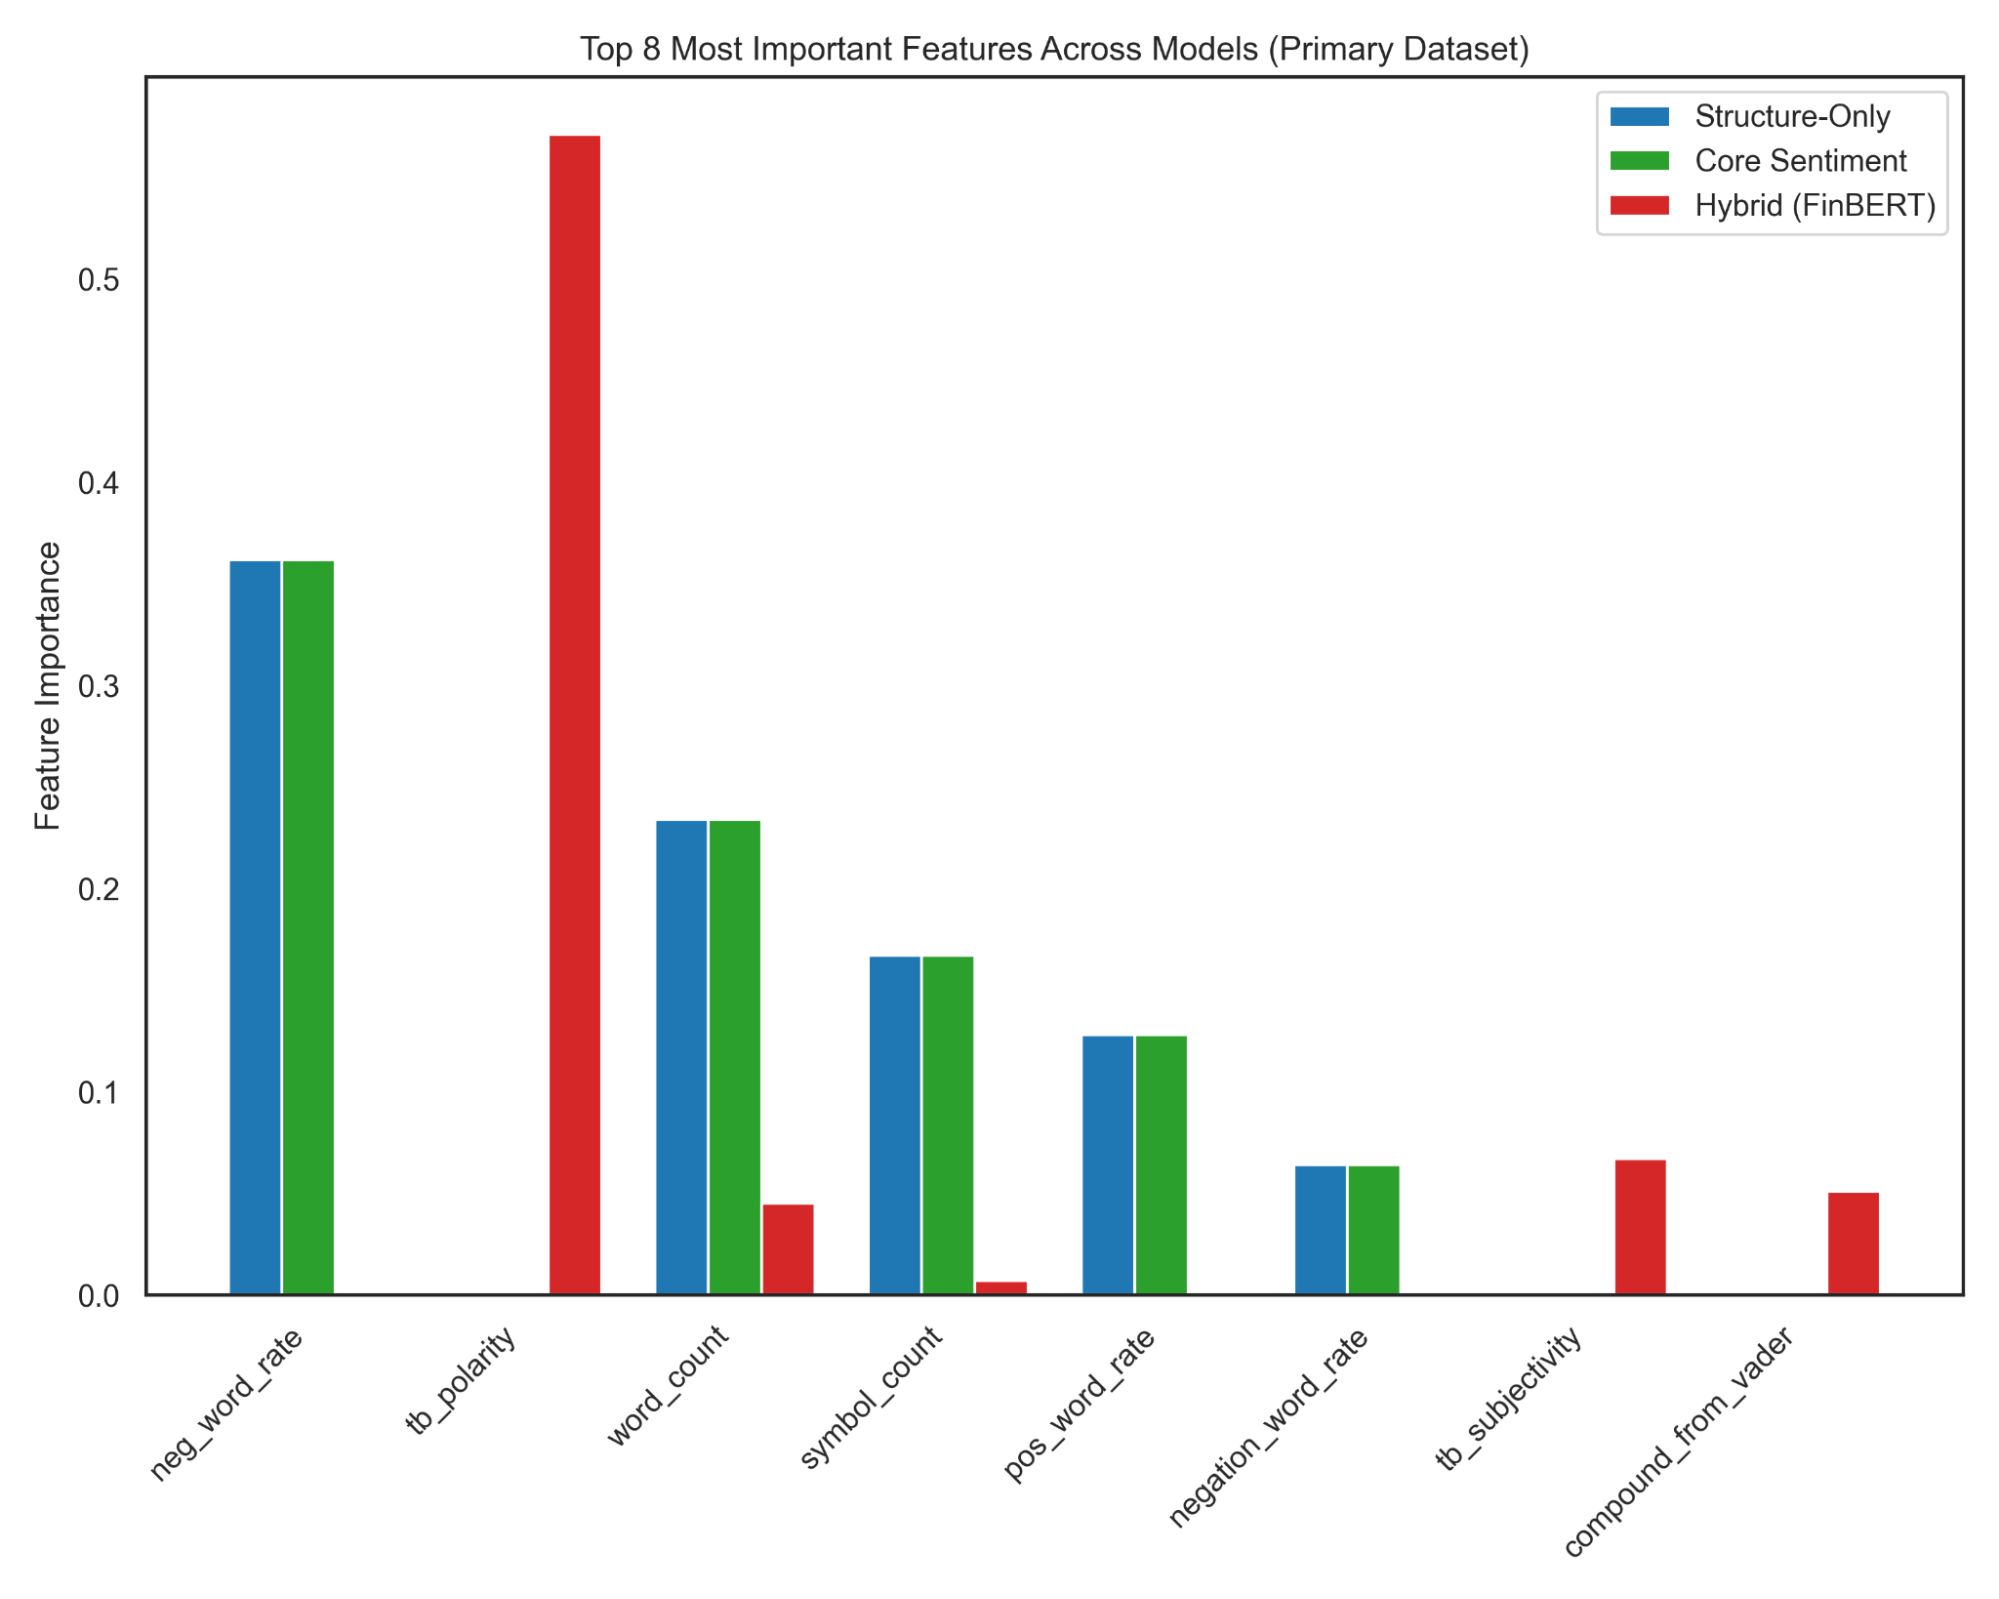
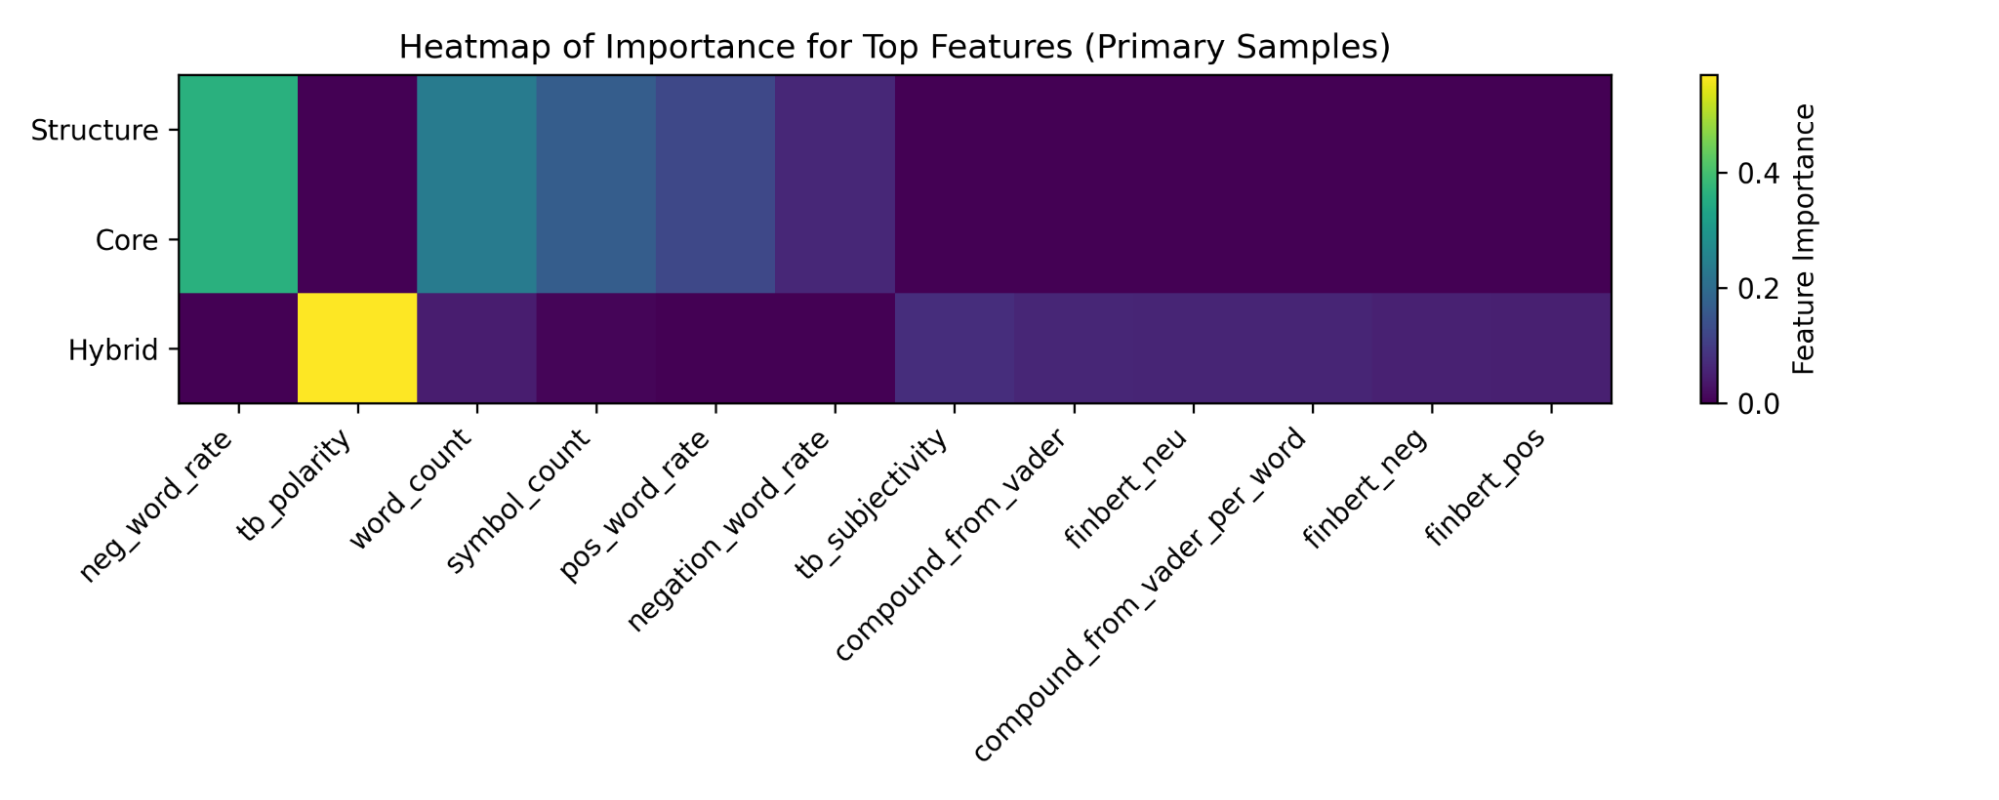
Figure 9—Heatmap and Chart illustrating the most influential features within each feature group—Structural, Core Lexicon, and Hybrid—under a shared Random Forest model. Identifying which features carry the greatest weight within their respective groups provides insight into the linguistic signals emphasized by each feature set. This type of analysis supports the broader iterative feature-engineering process used throughout the project, informing decisions about which features or feature groups are most promising before evaluating their performance across diverse datasets.
2.2 Prediction and Predictive Modeling for Sentiment and Spam Analysis
Logistic Regression and Random Forest (see Appendix) were selected as the primary predictive models for sentiment and spam classification. These models offer complementary strengths that align well with both the structure of the engineered features, the variability of the datasets, and the finalized modeling pipeline prototype to predict Reddit posts in this project.
In practice, the two models behaved differently across datasets. Logistic Regression showed relatively stable train–test performance across all data sources, reflecting its simpler linear structure. Random Forest, in contrast, frequently achieved very low training error but displayed more variability in test performance, a pattern consistent with higher-capacity models applied to small or noisy text datasets. Because of these differences, the modeling roles were separated: Logistic Regression was assigned to spam filtering, where the decision boundary is simple, while Random Forest was used for multi-class sentiment classification, where richer feature interactions are beneficial.
The heterogeneity of features engineered in this project—from hard coding the extraction of structural features, and utilizing NLP models and libraries for core lexicon features, and hybrid features (see 1.3) — naturally benefits with Random Forest, capturing nonlinear thresholds and multi-feature decision paths. This capability is especially important for datasets drawn from diverse social media platforms, where stylistic conventions, text formatting, and linguistic behaviors vary widely. These considerations are especially relevant when anticipating the characteristics of Reddit data: variation in tone, formatting, length, and linguistic style, especially in the context of subreddits and conversational context. An ensemble of decision trees, as implemented in Random Forest, can adapt to this diversity by allowing different trees to specialize in different structural or linguistic patterns.
To emphasize feature generalization rather than optimization of a single model configuration, the pipeline held classifier settings constant while comparing performance across datasets differing in platform culture, text style, and linguistic variability. This approach reflects the core goal of the project: to evaluate whether engineered features (structural, lexicon, and Hybrid Features) generalize across different linguistic domains.
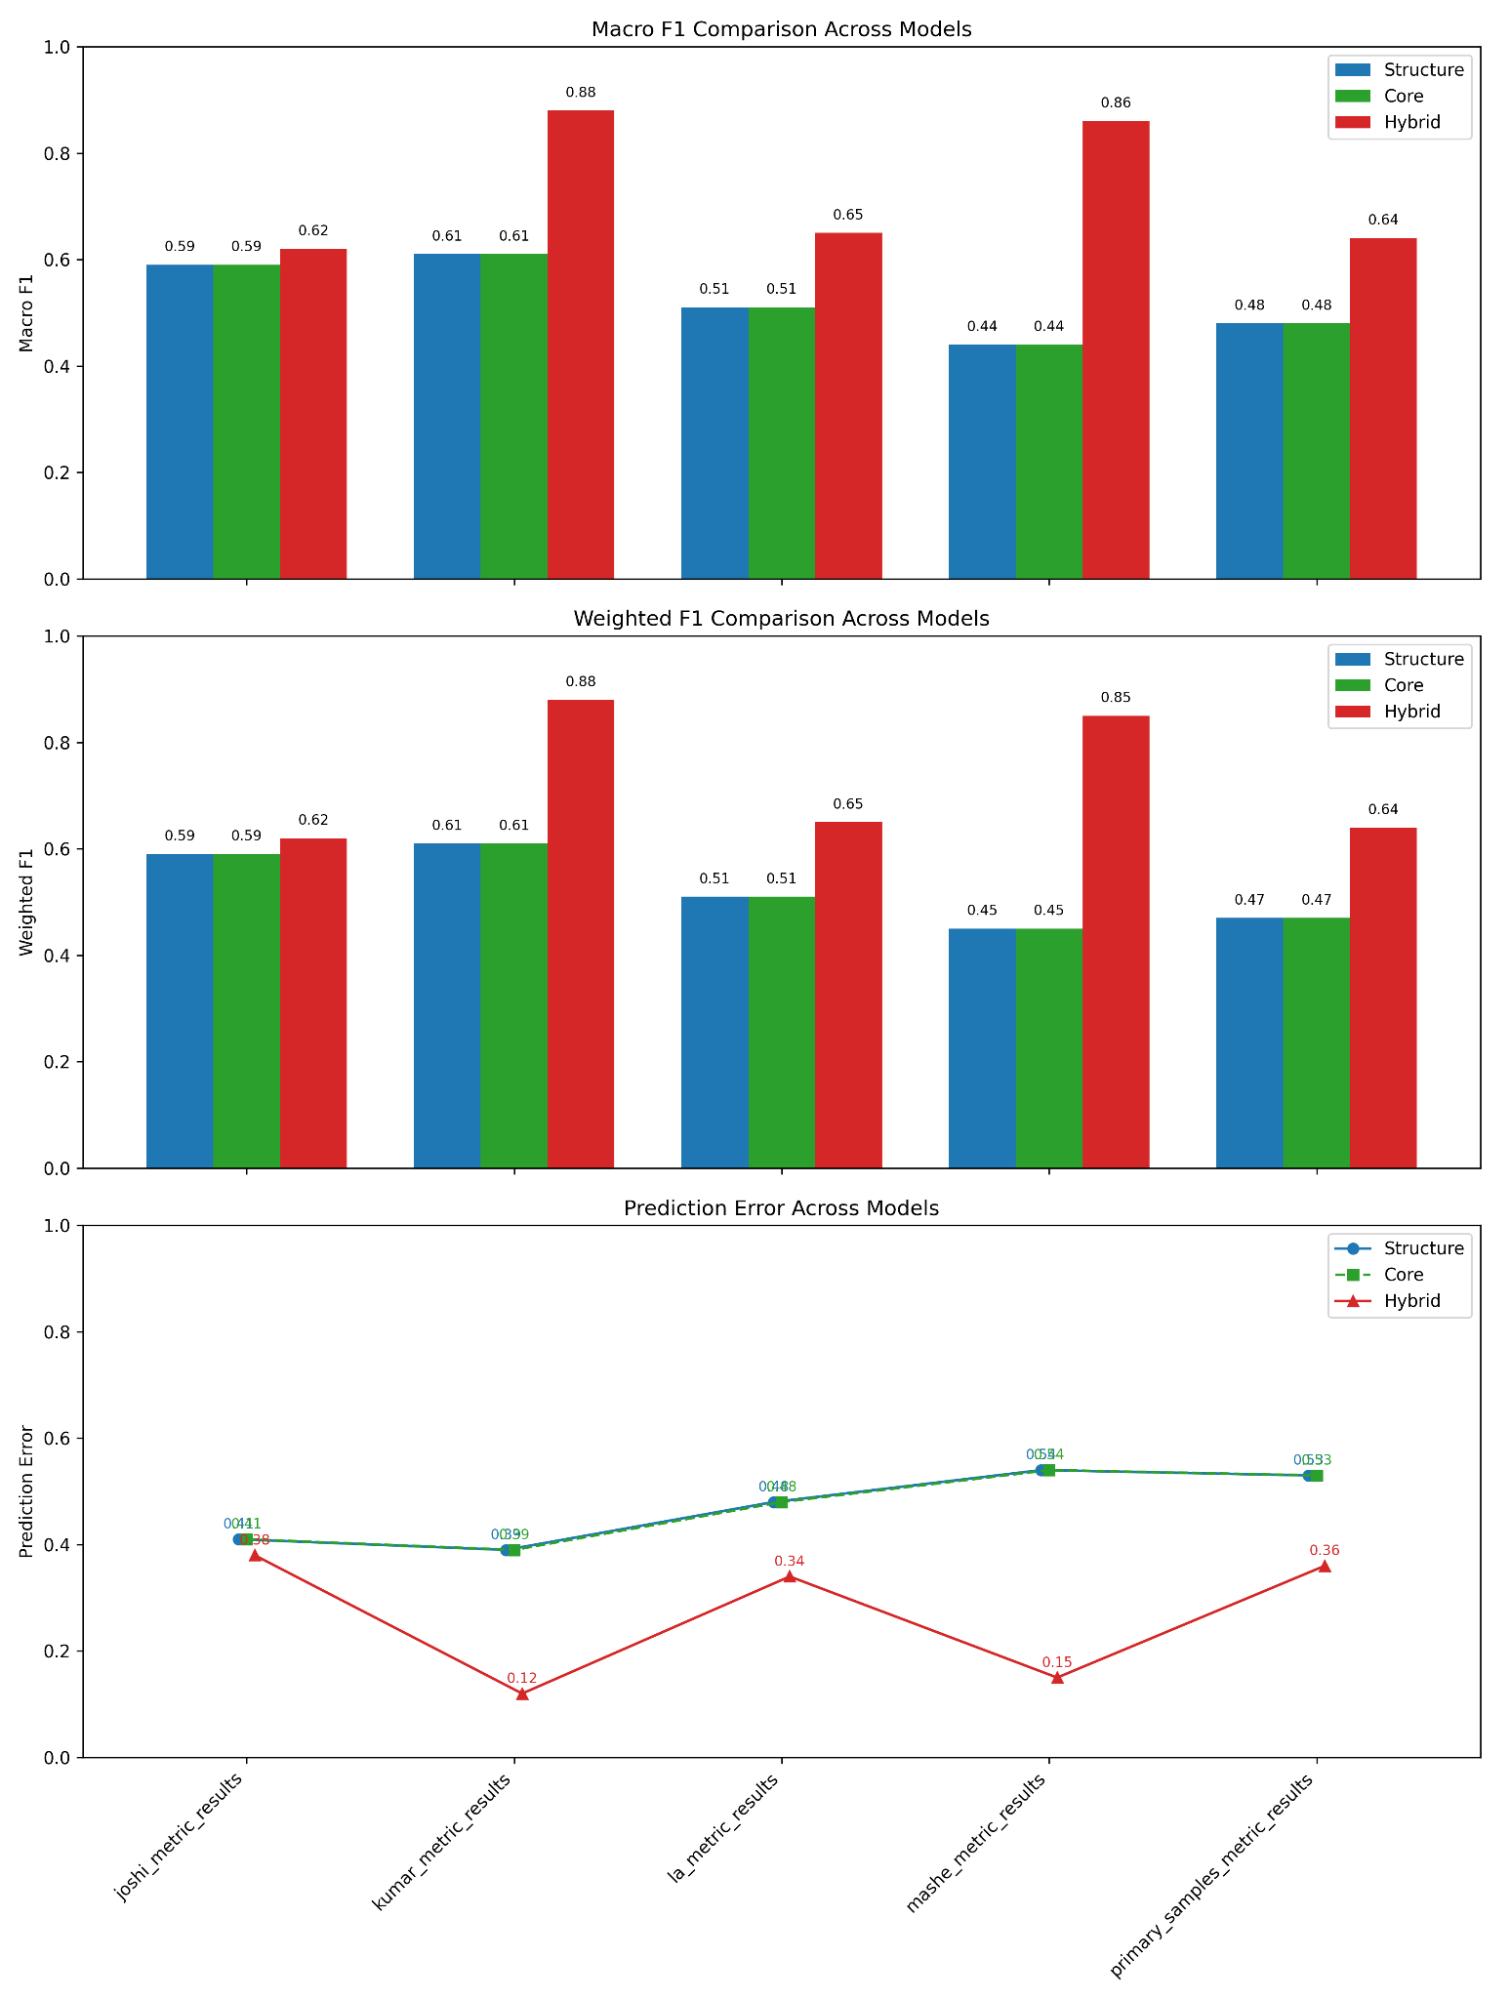
Figure 11—Random Forest Tree results in Macro F1, Weighted F1, and Prediction Error for Structure, Core, and Hybrid feature sets across all sample datasets. Performance levels vary across datasets due to differences in writing style and platform conventions, but Hybrid Features consistently achieve the highest scores. The figure highlights how linguistic variability affects overall difficulty while preserving the same feature-set ranking.
Macro F1 and Weighted F1 were reported to provide class-level insight into sentiment prediction performance, especially in datasets with class imbalance. Macro F1 treats each sentiment category equally, while Weighted F1 accounts for class frequency. These metrics were chosen because accuracy alone can obscure whether minority sentiment classes (positive, neutral, or negative) are being predicted well.
2.3 Statistical Inference on Predicted Sentiment and Economic Trends
The finalized pipeline—consisting of Logistic Regression for spam filtering and a Random Forest classifier applied to the Hybrid Feature set for multi-class sentiment prediction—successfully generated sentiment estimates for Reddit posts despite the constraints of limited and temporally clustered data.
The final stage of this project applies the modeled sentiment labels to a recent collection of Reddit posts and comments related to economics, housing, finance, inflation, and employment (see figure 12).
To explore potential relationships between public sentiment and real-world economic conditions, predicted sentiment was aligned with monthly macroeconomic indicators obtained through the Federal Reserve Economic Data (FRED) API, specifically unemployment rates (UNRATE) and the Job Openings Rate (JTSJOR). These indicators were selected because they represent broad labor-market conditions that often drive public concern around affordability, housing, and financial stability.
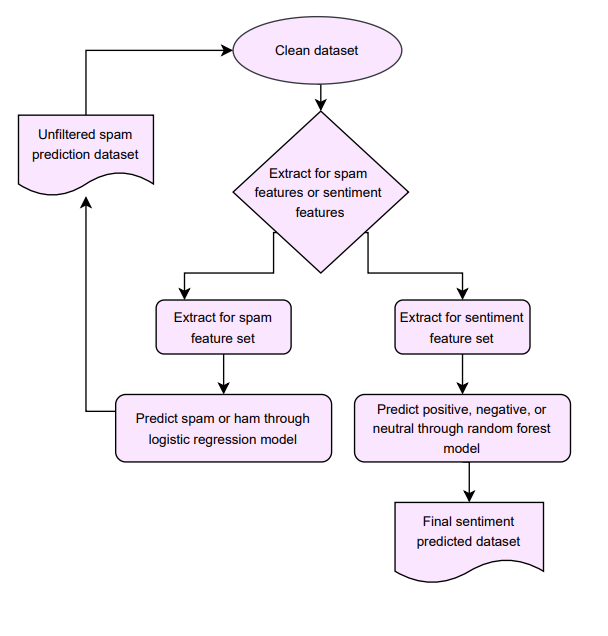
Figure 12—Pipeline prototype for Reddit sentiment classification, producing a time-stamped sequence of predicted sentiment values reflecting public economic discussions across Reddit.
The objective of this section is not to establish definitive causal relationships, but rather to assess whether meaningful alignment exists between economic events and shifts in public sentiment. The initial research questions continue to guide the exploratory analysis:
Do negative discussions spike when housing prices rise or affordability drops?
- Have there been drastic changes in the United States economy and is this change reflected in the media as well?
- Does sentiment lead the economic trend (predictive power)?
- Housing prices
- Bureau of Labor Statistics (BLS) Employment/Unemployment rates
3 Analysis and Results
3.1 Model Results
Across datasets, Hybrid Features consistently produced the strongest performance, achieving the highest Macro F1, Weighted F1, and lowest prediction error in every sample. However, the magnitude of these gains varied by dataset due to differences in writing style, text length, and platform conventions. Reddit-like datasets (Joshi, Kumar, Mashe) showed the largest improvements when Hybrid Features were used, reflecting their longer, informal, and linguistically varied text. In contrast, the La dataset—composed of short, highly standardized news headlines—showed smaller gains. Although this dataset is related to financial news, its headline-style phrasing provides limited contextual and structural cues for FinBERT and other Hybrid Features to leverage, reducing the benefit of the richer feature set. Overall, the results indicate that while Hybrid Features generalize well across domains, the degree of improvement is strongly influenced by each dataset’s linguistic characteristics. As such, the Random Forest results should be interpreted as a demonstration of feature-engineering strategies and cross-dataset comparison.
3.2 Prototype Pipeline Results
The finalized pipeline—consisting of Logistic Regression for spam filtering and a Random Forest classifier applied to the Hybrid Feature set for multi-class sentiment prediction—successfully generated sentiment estimates for Reddit posts despite the constraints of limited and temporally clustered data.
Although an inverse pattern appears—sentiment increasing as unemployment declines and dropping sharply at the end—these fluctuations likely reflect data sparsity and extraction limitations rather than meaningful economic signals. The PRAW API doesn’t permit retrieval of posts by timestamp, which led to heavily clustered within recent months, resulting in a restricted, uneven, and relatively small sample. This constraint, combined with class imbalance within the sentiment labels, results in a noisy sentiment trend that cannot accurately describe economic patterns.
As a result, the findings should be interpreted primarily as a demonstration of the end-to-end modeling pipeline rather than as supporting evidence of any underlying economic relationship. Future work using larger, time-balanced datasets would be required to investigate the hypotheses.
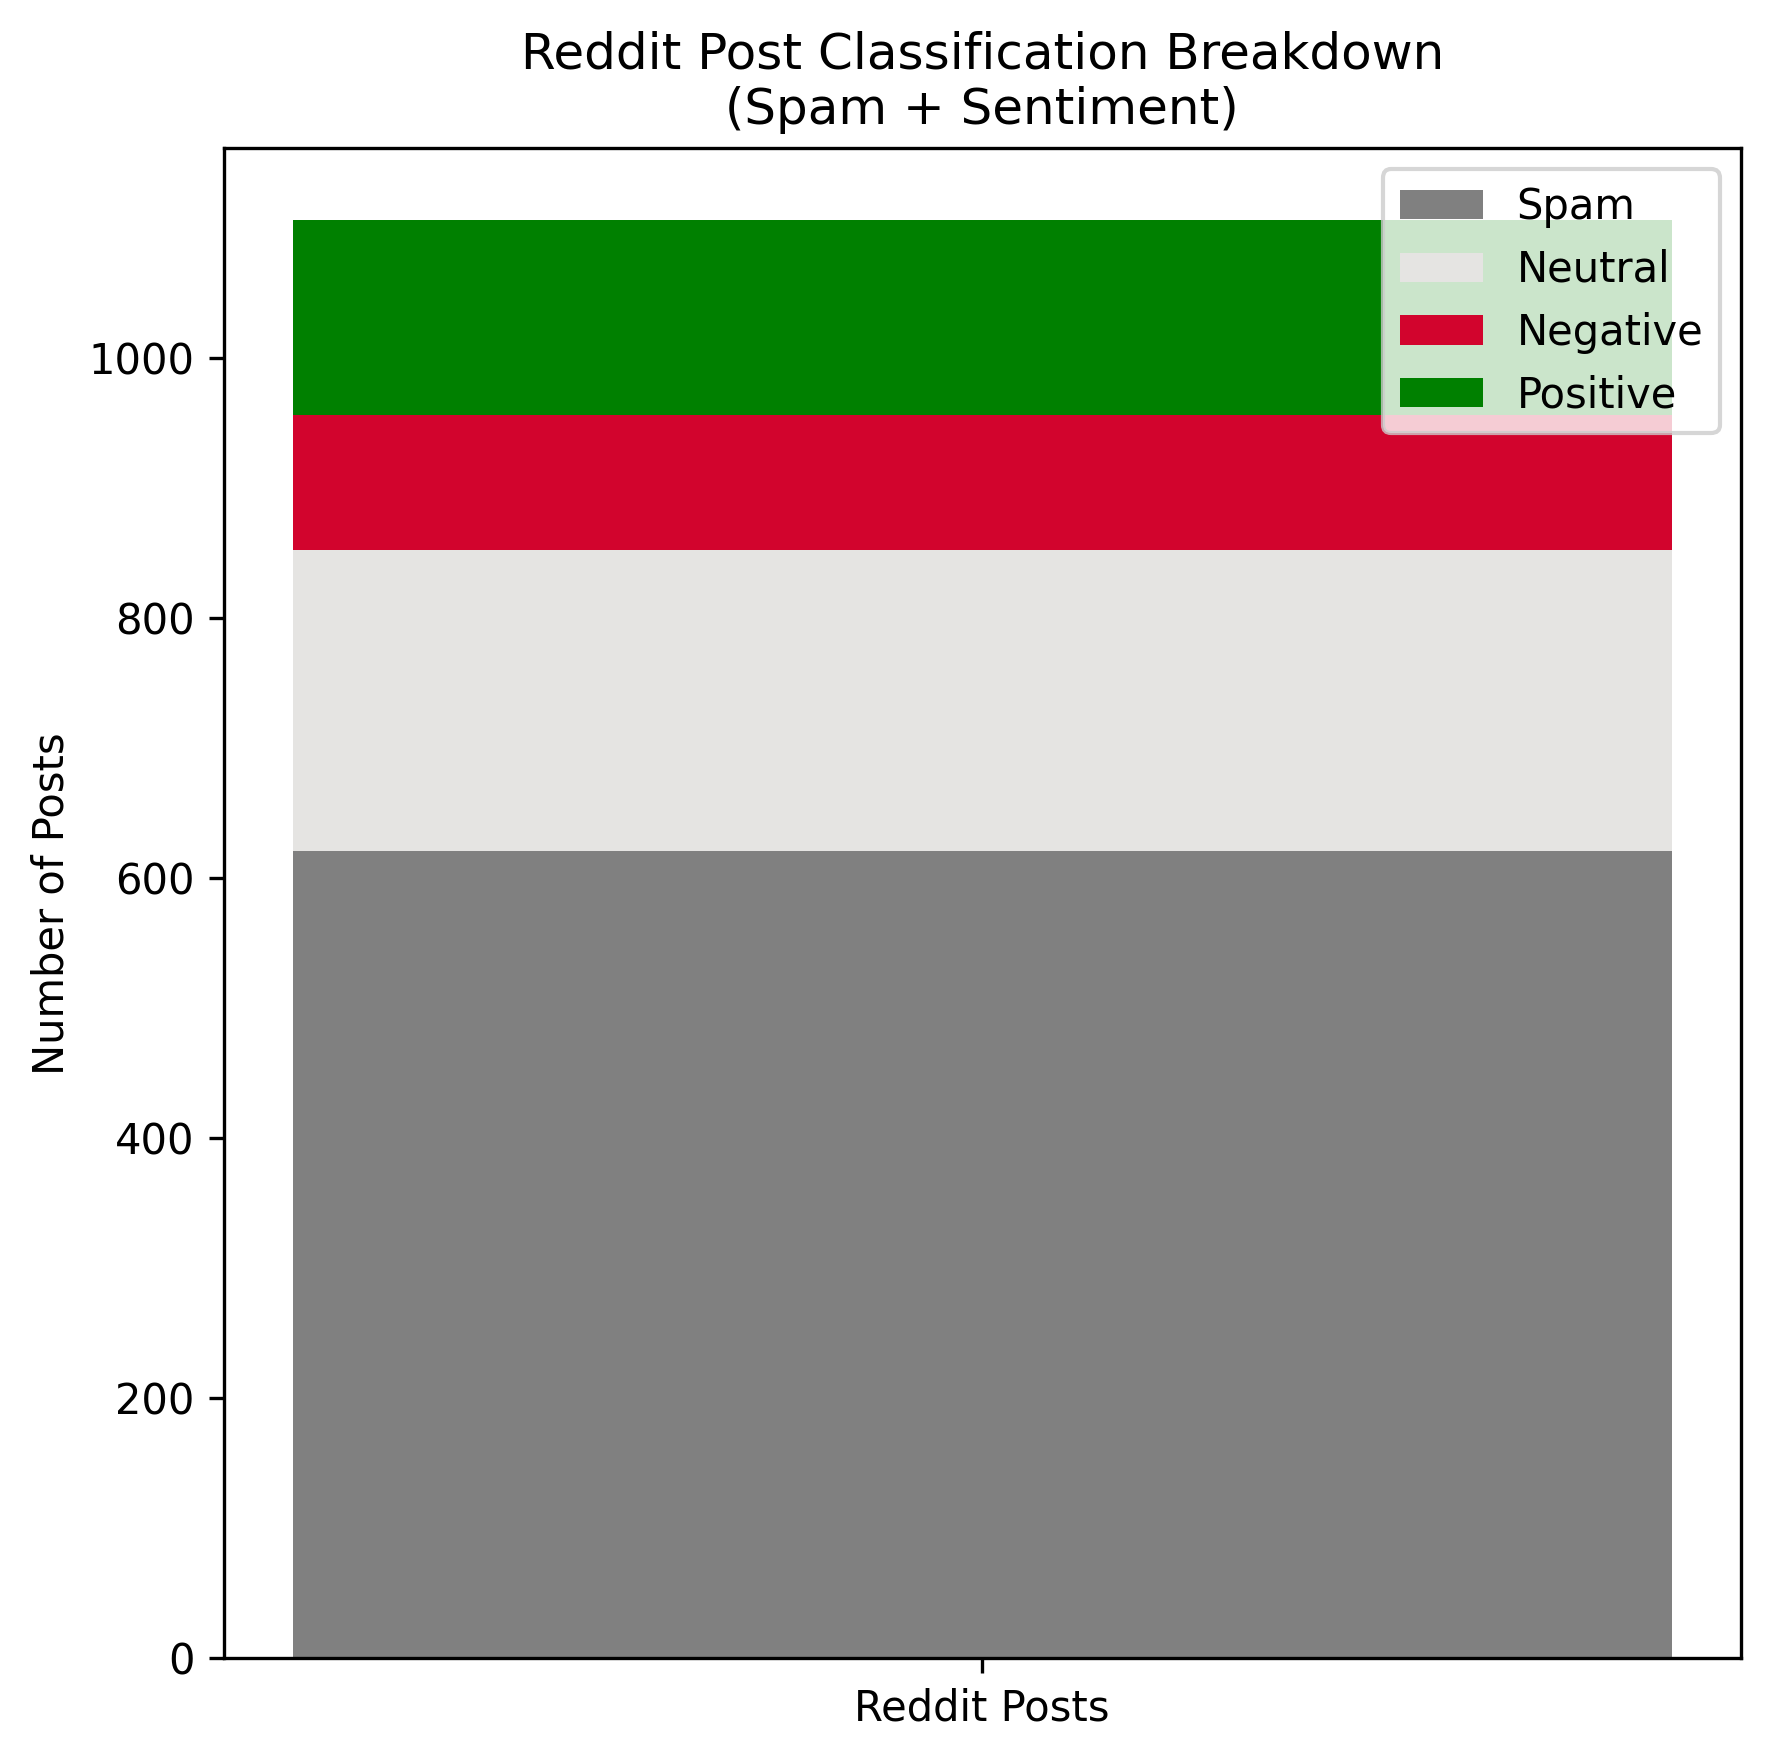
Figure 13 — Reddit posts prediction results - composition of classification results for number of posts retrieved. More than half of posts were classified as spam, Neutral dominated sentiment labeling and Negative was least classified.
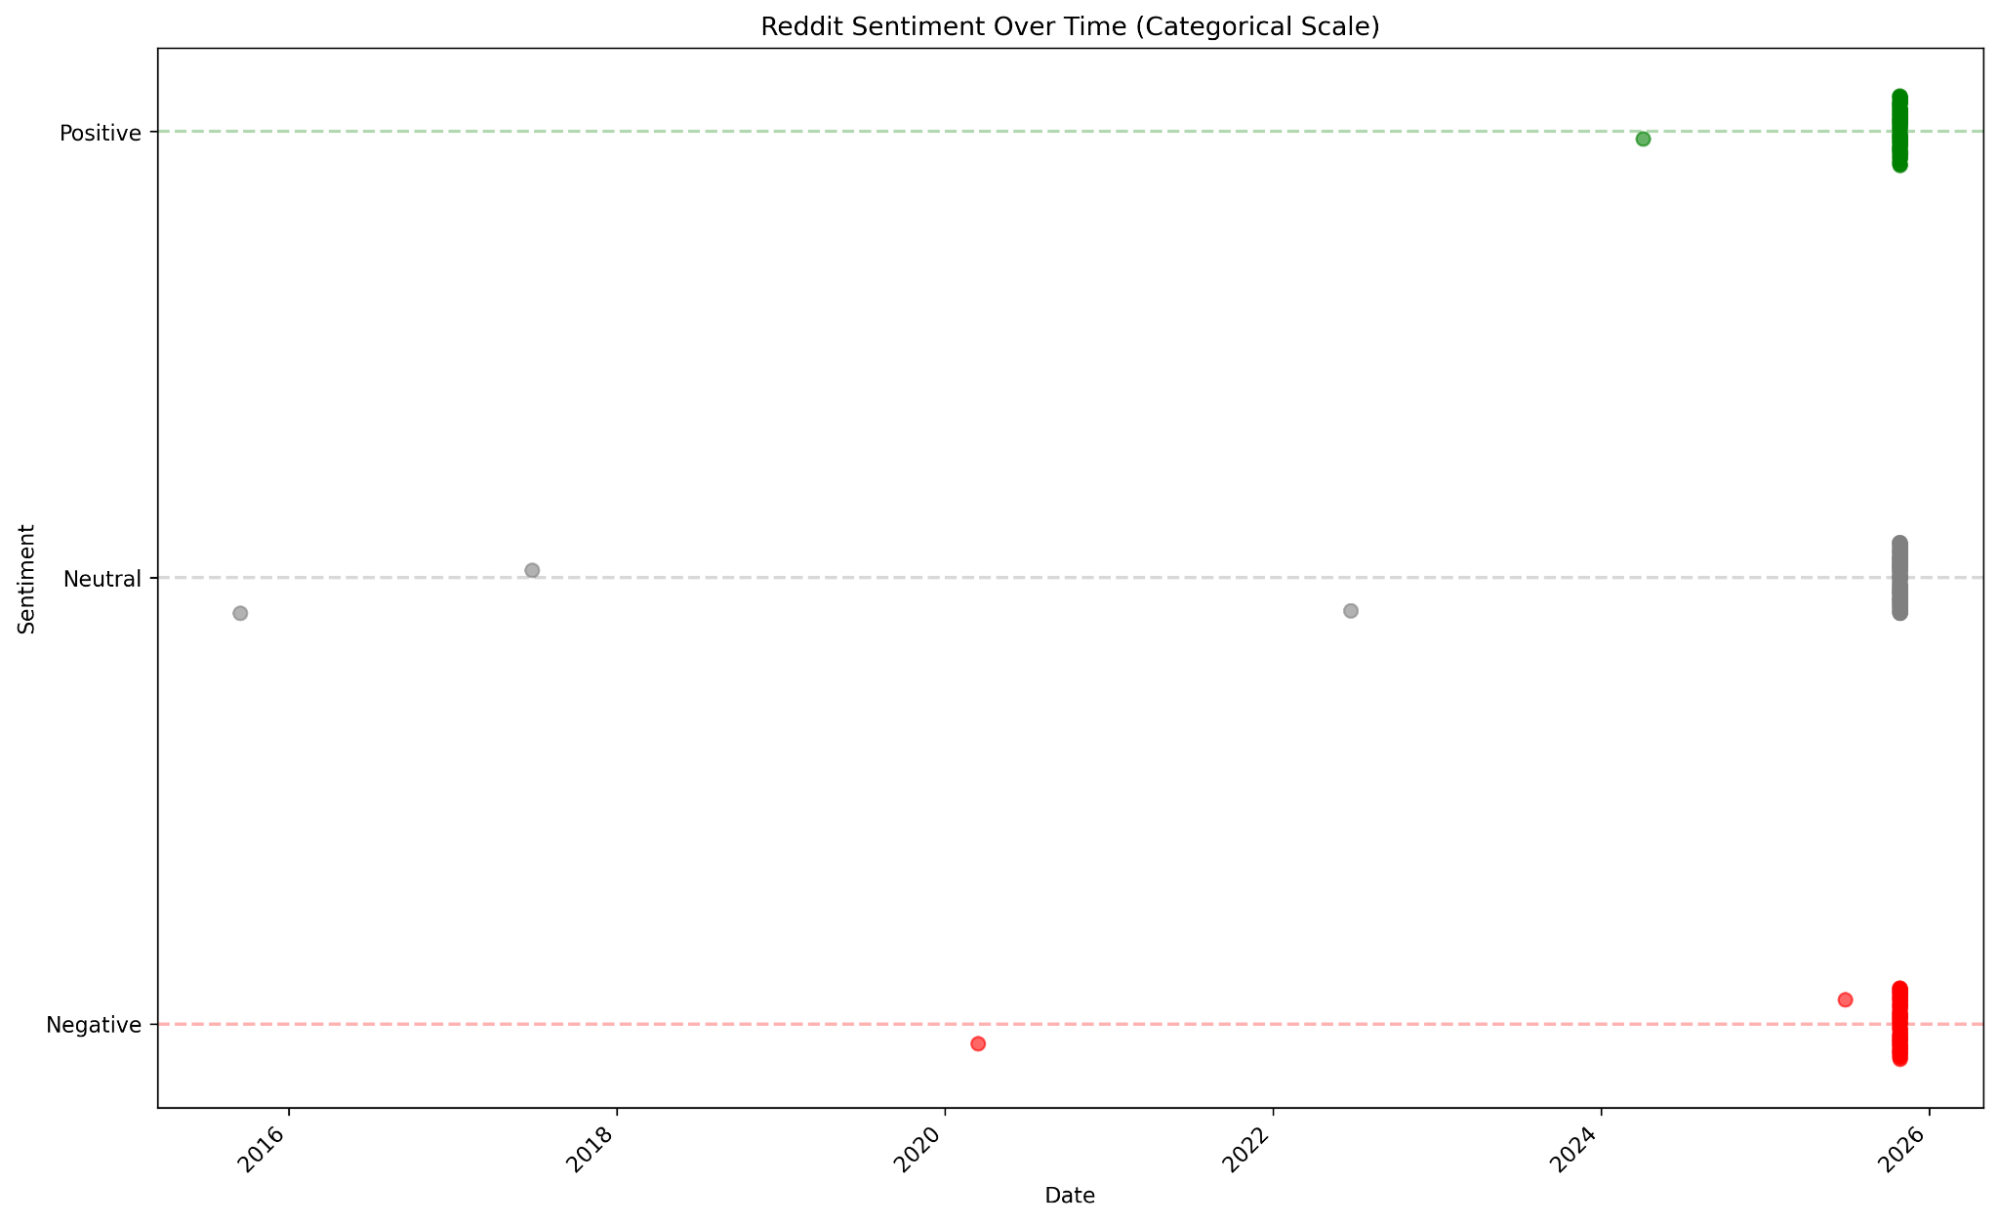
Figure 14— Reddit posts prediction results, relative to date posted. The majority of posts retrieved were posted in 2025.
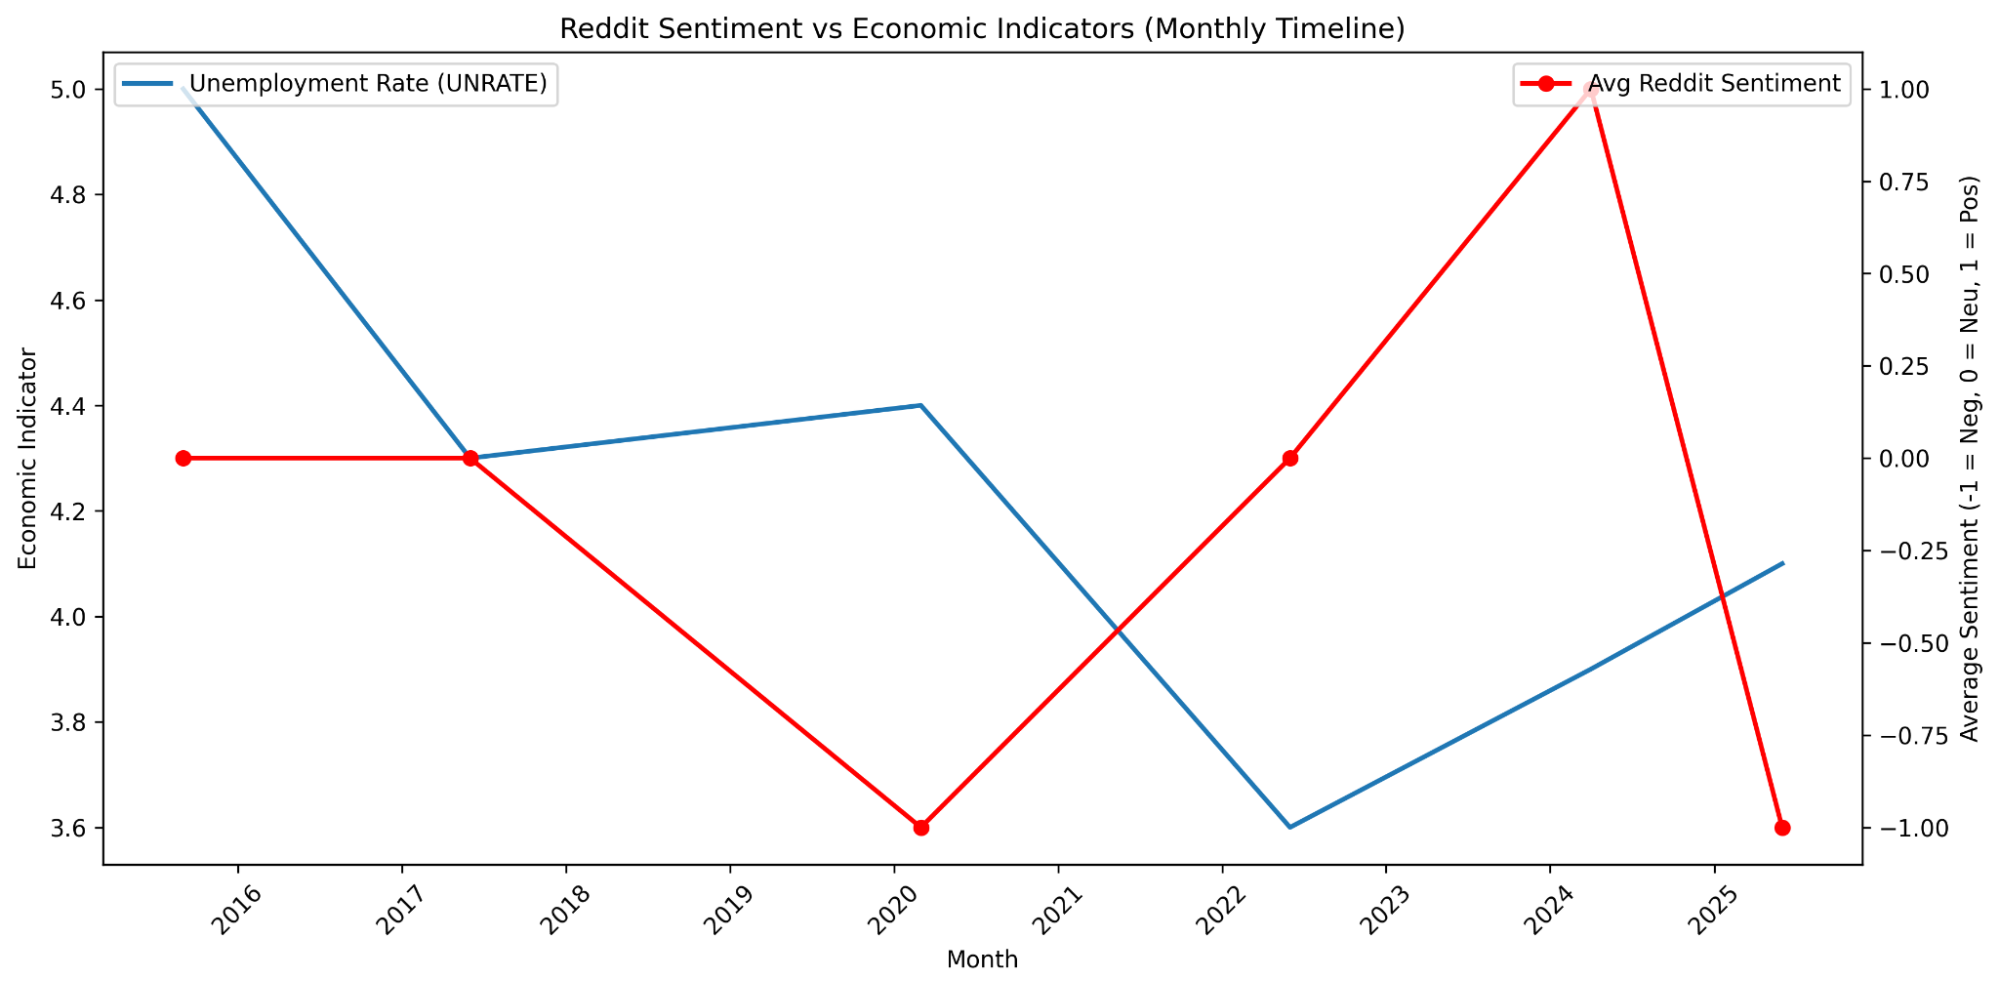
Figure 15—Average posts prediction results, relative to date posted and unemployment rate retrieved from Federal Reserve Economic Data.
4 Lessons Learned
I took on the scope of this project with the intention of familiarizing myself with how data mining pipelines work from end to end and developing a deeper, practical understanding of applied analytics. I started with an ambitious proposal and dove right in, extracting reddit posts, working with datasets (many of which I decided to not use) and experimenting with how I wanted to position models in the pipeline.
Considering the scope of the project, the timeline, and my initial knowledge with sentiment analysis and open source libraries, the biggest takeaway for me is to not overpromise on a deadline. I spent a lot of time learning how open source models work, variations in sentiment analysis, extracting Reddit posts, and automating workflows after repeatedly finding myself coding or testing the same things in different variations.
I also could’ve saved a lot of time if I kept track of meta data, rather than gathering it near the end of the project. Small things like that would’ve helped me come up with automations quicker, envision exactly what I needed, and would’ve relieved a lot of time with problem solving and finalizing my findings.
In terms of technicality, I’ve grown a deeper understanding of the capabilities with Python, and efficiently organizing, extracting, and plotting data as I need. Incorporating different models for different purposes (like Linear Regression for spam detection, Finbert for economic contextualized text), and recognizing and creating patterns early, are all important for the sake of automation and experimenting with different datasets in a domain that I’m not strong in.
5 Bibliography and Credits
- Araci, D. (2019). FinBERT: Financial sentiment analysis with pre-trained language models. arXiv. https://arxiv.org/abs/1908.10063
- Burns, D. (2025, November 6). US unemployment rate rounds up to 4.4% in October, Chicago Fed estimates. Reuters. https://www.reuters.com/world/us/us-unemployment-rate-rounds-up-44-october-chicago-fed-estimates-2025-11-06/
- Hutto, C. J., & Gilbert, E. (2014). VADER: A parsimonious rule-based model for sentiment analysis of social media text. In Proceedings of the International AAAI Conference on Web and Social Media (Vol. 8, No. 1, pp. 216–225). https://ojs.aaai.org/index.php/ICWSM/article/view/14550
- Malo, P., Sinha, A., Takala, P., Korhonen, P., & Wallenius, J. (2013). Good debt or bad debt: Detecting semantic orientations in economic texts. arXiv. https://arxiv.org/abs/1307.5336
- Matsumoto, B., & Stockburger, A. (2025). Measurement issues in consumer price indexes (Economic Working Paper No. WP-584). Office of Prices and Living Conditions.
- Mohammad, S. M., & Turney, P. D. (2013). Crowdsourcing a word–emotion association lexicon. Computational Intelligence, 29(3), 436–465. https://doi.org/10.1111/j.1467-8640.2012.00460.x
- Neal Caren. (2019, May 1). Word lists and sentiment analysis. https://nealcaren.org/lessons/wordlists/
- Newman, H. & Joyner, D. A. (2018). Sentiment Analysis of Student Evaluations of Teaching. In Proceedings of the 19th International Conference on Artificial Intelligence in Education. London, United Kingdom. Springer.
- Sok, E., Smith, S., & Evans, J. (2025, September). Unemployment rate increases in the first half of 2024, before leveling off, while the labor force participation rate holds fairly steady. Monthly Labor Review, U.S. Bureau of Labor Statistics. https://doi.org/10.21916/mlr.2025.17
- Visual Paradigm. (n.d.). Flowchart tutorial. Retrieved November 22, 2025, from https://www.visual-paradigm.com/tutorials/flowchart-tutorial/
7 Appendices
7.1 Glossary of Terms
BERT (Bidirectional Encoder Representations from Transformers): Analyzes text by simultaneously contextualized left and right directions, compared to traditional NLP models that contextualize left to right or right to left
Finbert: NLP model built on BERT, detecting sentiment on a financial domain (economic contextualized text)
Lexicon: Collection of words with associated sentiment values
Logistic Regression: Assumes a Bernoulli distribution for the response variable, where the probability of class membership is modeled directly rather than through the distribution of predictors. This makes logistic regression a discriminate model, as it avoids making assumptions about the relationships or independence of the predictor variables
Random Forest: Repeatedly uses the best predictor from a random subset of predictors at each split of each decision tree computed. Many decision trees combined into one model, aiming to minimize classification error. It captures feature importance through nonlinear relationships.
TextBlob: Python library for general NLP use
UCI Spam Database: Composed of features pre extracted from a set of emails, reported to have an accuracy rate of 91.920 using Logistic Regression.
UCI SMS Database: SMS messages with classified labels of ‘spam’ or ‘ham’
Vader: NLP model detecting sentiment using a lexicon and set of rules approach on a social media domain (slang, emojis, punctuation, etc.)
Visual Studio Code: Integrated Development environment used to implement and run code
Jupyter: Integrated Development Environment mainly for Python to implement and run code, convenient for exploratory analysis due to ease of viewing outputs while coding (data, graphs, etc.)
7.2.1 Pipeline— Model Evaluation
- Cleaned and preprocessed data in Jupyter then uploaded them into ./data/cleaned/{date}/{dataset}-{train_or_test}-cleaned.csv
- Run extraction and modeling from extract_and_model.py
- Runs ./data/cleaned/{date}/{dataset}-{train_or_test}-cleaned.csv through extracting.py, file is saved to ./data/extracted/{date}/{dataset}-{train_or_test}-{specific_feature_set}-extracted.csv
- Runs ./data/extracted/{dataset}-{train_or_test}-{specific_feature_set}-extracted.csv through modeling.py, results is saved to ./exploratory_analysis/{date}/{dataset}-{specific_feature_set}-extracted.csv
- Download results and run it through a meta-data collector function, organized by feature set with feature importances and model results, and name of the dataset
7.2.2 Pipeline— Model Evaluation
- Cleaned and preprocessed data in Jupyter then uploaded them into ./reddit/cleaned/{dataset}-cleaned.csv
- Run extraction and modeling from extract_and_model.py
- Runs
./reddit/cleaned/{dataset}-cleaned.csv through extracting.py, file is saved to ./reddit/extracted/{dataset}-extracted-for-spam.csv - Runs ./reddit/extracted/{dataset}-extracted-for-spam.csv through extracting.py, Saves predicted spam results file to ./reddit/predicted_spam/{dataset}-predicted_spam.csv
- Runs ./reddit/extracted/{dataset}-extracted-for-spam.csv through modeling.py, Saves predicted spam results file to ./reddit/predicted_spam/{dataset}-predicted_spam.csv
- Runs ./reddit/predicted_spam/{dataset}-predicted_spam.csv through modeling.py,
- Saves removed spam file to ./reddit/predicted_spam/{dataset}-removed_spam.csvt
- Saves predicted sentiment file (with original columns from predicted_spam) to ./reddit/predicted_sentiment/{dataset}-predicted_sentiment
- Download results and collect metadata