
Designing an Interactive EDA Workflow: Bridging Analysis and Presentation
A transition from full-stack development to data science through exploratory analysis, reasoning, and interactive design
Introduction - The Problem Statement
This project marked a shift from full-stack product building to hands-on data exploration and storytelling. Instead of starting with a fixed hypothesis or outcome, I worked with a large behavioral dataset and allowed the analysis to evolve through exploration. As new questions emerged, I continuously adapted my approach, stepping into the role of a data analyst while leveraging my background in backend and web development.
Beyond analysis, the goal was to design an environment where code, results, and insights live together. By connecting exploratory work in Jupyter with an interactive full-stack application, this project bridged data exploration and presentation, emphasizing clarity, curiosity, and user experience.
1 Exploratory Analysis
EDA was the core driver of this project. Rather than treating exploration as a preliminary step, I used EDA as a reasoning process—asking analytical questions, testing assumptions, and letting patterns, anomalies, and gaps in the data guide the direction of the analysis.
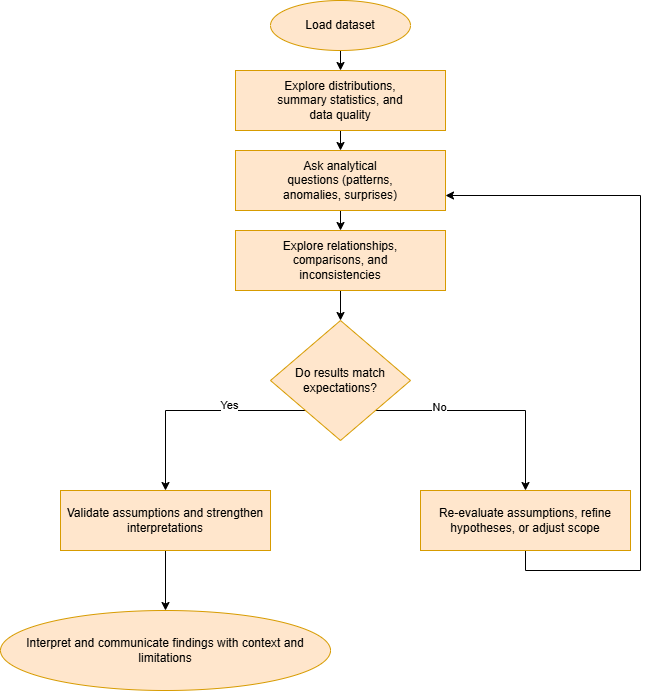
Figure 1— EDA as an iterative thinking process, where questions, exploration, and interpretation evolve together.
Working in Python with pandas and Jupyter Notebook, I iteratively examined distributions, relationships, and inconsistencies within the dataset. As insights emerged, I refined hypotheses and adjusted the scope of the analysis, especially when expected relationships—such as strong correlations between social media usage and productivity—did not appear as anticipated. This reinforced the importance of exploration in understanding behavioral data before moving toward formal conclusions or modeling.
2 Methodology
As the EDA evolved, I translated the exploratory workflow into a structured, interactive system. I built a Flask application that guides users through the analysis step-by-step, mirroring the progression of questions and insights developed during exploration.
The application uses pandas for data manipulation and transformation, with custom Python functions and routes handling data exchange via JSON. I implemented file handling logic to support importing and exporting datasets, and used both synchronous and asynchronous execution where appropriate to maintain responsiveness.
To improve readability and storytelling, I also built a regex-based syntax highlighter that mimics Jupyter-style code presentation on the web. This allowed code, outputs, and explanations to be presented together, helping users follow the analytical logic as it unfolded
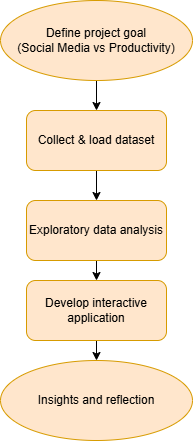
Figure 2— The diagram summarizes the project lifecycle, from defining the research goal and collecting data to performing exploratory data analysis, developing an interactive application, and synthesizing insights and reflections.
3 Results
Rather than producing a single definitive metric or model, the project resulted in a cohesive analytical narrative shaped by exploration. The results highlighted patterns, inconsistencies, and structural limitations within the dataset, offering insight into the complexity of measuring productivity and social media behavior.
While strong correlations were not consistently observed, the findings themselves were informative. They emphasized the need to interpret results in context and avoid forcing conclusions where the data does not support them. Results were surfaced through an interactive interface that connects raw data, transformed views, and interpretive summaries, allowing users to see how conclusions evolved from the EDA process.
4 Findings and Analysis
This project strengthened my analytical thinking by reinforcing the value of question-driven exploration over confirmation. I practiced interpreting ambiguous or unexpected results, reassessing assumptions, and evaluating the credibility and structure of the dataset itself.
From a technical perspective, the project reinforced Python fluency while expanding my development skill set. I integrated Jupyter, Flask, and pandas into a unified workflow, built reusable functions for data handling, and designed presentation logic that prioritizes clarity and user comprehension. Throughout the project, I maintained a product-thinking mindset—focusing on how users experience the analytical journey, not just the final outputs. I’m excited to continue developing these skills as I begin my Master’s in Analytics and pursue data-focused internships.
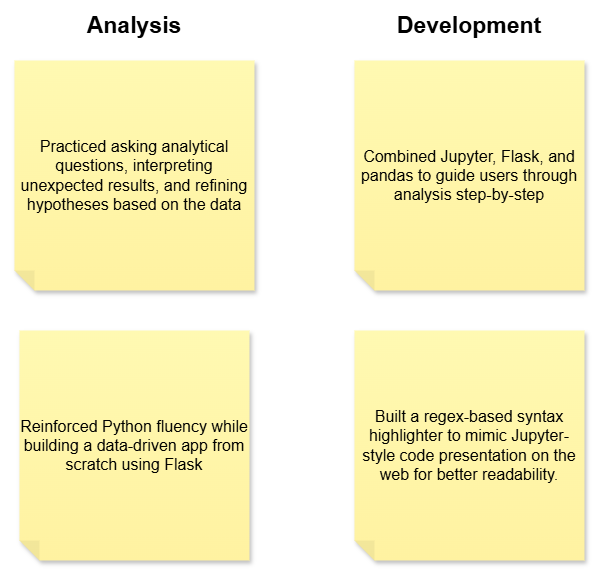
Figure 3— Analysis and development skills strengthened through an interactive exploratory data analysis project.